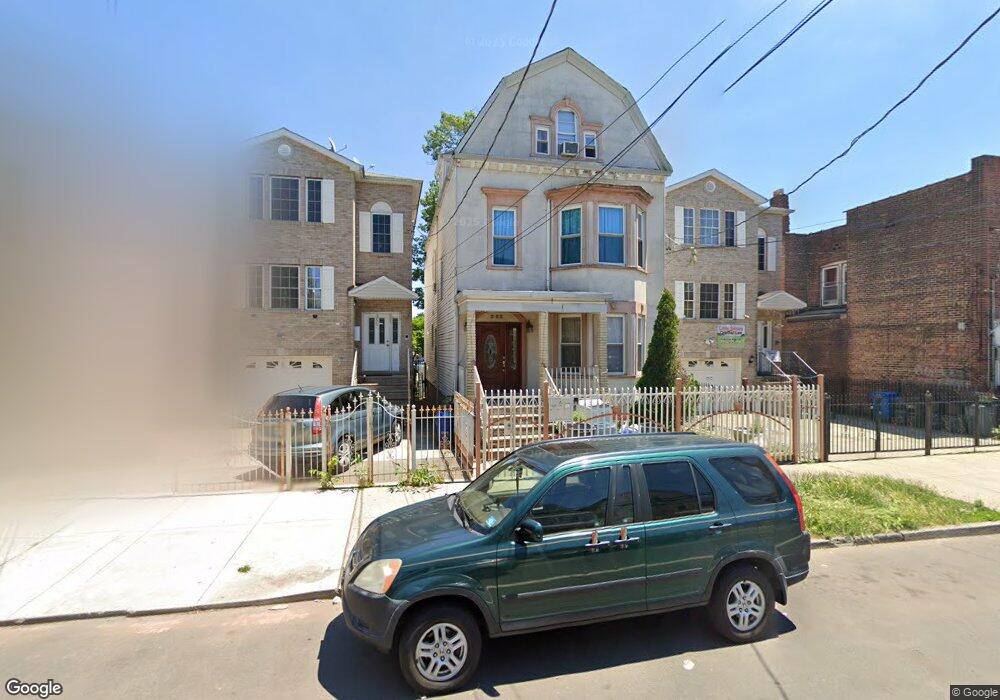
353 N 7th St Unit 3 Newark, NJ 07107
Lower Roseville NeighborhoodEstimated Value: $569,947 - $753,000
8
Beds
4
Baths
2,774
Sq Ft
$249/Sq Ft
Est. Value
About This Home
This home is located at 353 N 7th St Unit 3, Newark, NJ 07107 and is currently estimated at $690,237, approximately $248 per square foot. 353 N 7th St Unit 3 is a home located in Essex County with nearby schools including Dr. William H. Horton School, First Avenue Elementary School, and Franklin School.
Ownership History
Date
Name
Owned For
Owner Type
Purchase Details
Closed on
Nov 29, 2018
Sold by
Lozano Luis and Lozano Maria
Bought by
Sarango Fabian H
Current Estimated Value
Home Financials for this Owner
Home Financials are based on the most recent Mortgage that was taken out on this home.
Original Mortgage
$351,515
Outstanding Balance
$310,310
Interest Rate
4.9%
Mortgage Type
FHA
Estimated Equity
$379,927
Purchase Details
Closed on
Nov 29, 1997
Sold by
Arana Pasual
Bought by
3R Mgt
Purchase Details
Closed on
Oct 10, 1991
Sold by
Arana Luz
Bought by
Arana Pascual
Create a Home Valuation Report for This Property
The Home Valuation Report is an in-depth analysis detailing your home's value as well as a comparison with similar homes in the area
Home Values in the Area
Average Home Value in this Area
Purchase History
| Date | Buyer | Sale Price | Title Company |
|---|---|---|---|
| Sarango Fabian H | $358,000 | -- | |
| 3R Mgt | $12,000 | -- | |
| Arana Pascual | $100 | -- |
Source: Public Records
Mortgage History
| Date | Status | Borrower | Loan Amount |
|---|---|---|---|
| Open | Sarango Fabian H | $351,515 |
Source: Public Records
Tax History Compared to Growth
Tax History
| Year | Tax Paid | Tax Assessment Tax Assessment Total Assessment is a certain percentage of the fair market value that is determined by local assessors to be the total taxable value of land and additions on the property. | Land | Improvement |
|---|---|---|---|---|
| 2025 | $9,491 | $254,600 | $27,500 | $227,100 |
| 2024 | $9,491 | $254,600 | $27,500 | $227,100 |
| 2022 | $9,512 | $254,600 | $27,500 | $227,100 |
| 2021 | $9,507 | $254,600 | $27,500 | $227,100 |
| 2020 | $9,675 | $254,600 | $27,500 | $227,100 |
| 2019 | $5,901 | $156,900 | $27,500 | $129,400 |
| 2018 | $5,794 | $156,900 | $27,500 | $129,400 |
| 2017 | $5,586 | $156,900 | $27,500 | $129,400 |
| 2016 | $5,397 | $156,900 | $27,500 | $129,400 |
| 2015 | $5,192 | $156,900 | $27,500 | $129,400 |
| 2014 | $4,865 | $156,900 | $27,500 | $129,400 |
Source: Public Records
Map
Nearby Homes
- 352 N 7th St
- 372 N 7th St
- 362 N 6th St
- 382-384 N 7th St
- 323 N 7th St
- 318 N 7th St
- 349 N 5th St
- 347 N 5th St Unit 349
- 226 N 9th St
- 166 N 9th St Unit 3
- 457 N 7th St
- 248 N 7th St Unit 248
- 118 N 9th St Unit 120
- 118-120 N 9th St
- 277 2nd Ave W Unit 2
- 277 2nd Ave W
- 504 N 7th St Unit 506
- 504-506 N 7th St
- 261 Lake St
- 126 Highland Ave