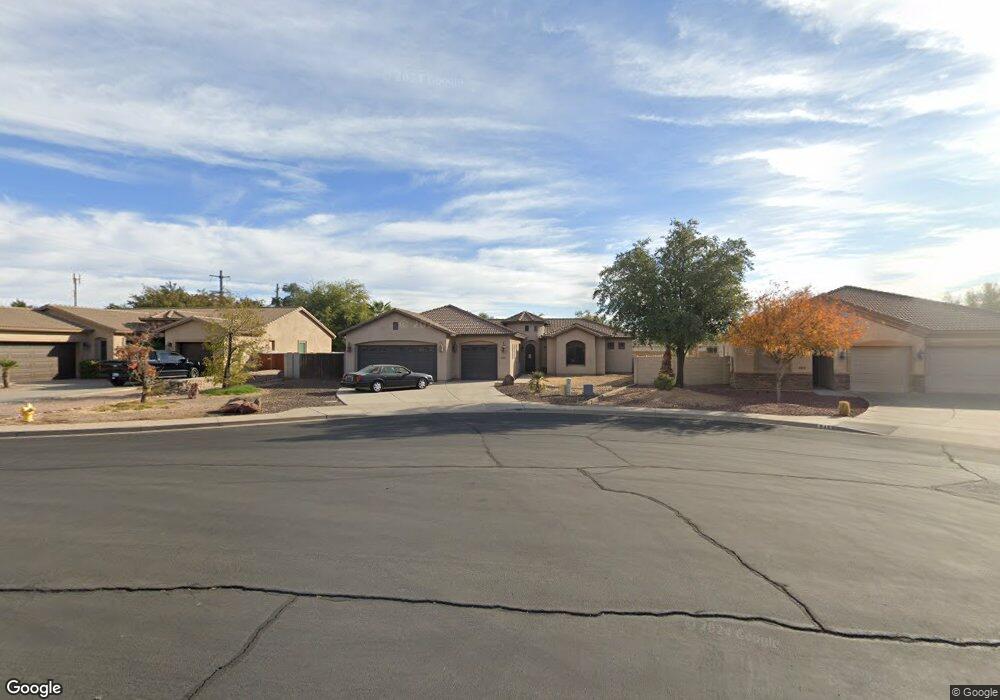
353 N Chatsworth Cir Mesa, AZ 85207
University Manor NeighborhoodEstimated Value: $401,000 - $549,000
4
Beds
3
Baths
2,453
Sq Ft
$202/Sq Ft
Est. Value
About This Home
This home is located at 353 N Chatsworth Cir, Mesa, AZ 85207 and is currently estimated at $494,626, approximately $201 per square foot. 353 N Chatsworth Cir is a home located in Maricopa County with nearby schools including Sousa Elementary School, Franklin at Brimhall Elementary School, and Franklin West Elementary School.
Ownership History
Date
Name
Owned For
Owner Type
Purchase Details
Closed on
Jun 27, 2018
Sold by
Eberson Jozel Z
Bought by
Eberson Susan
Current Estimated Value
Purchase Details
Closed on
Jul 16, 2009
Sold by
Webster Bank National Association
Bought by
Eberson Jozef Z
Home Financials for this Owner
Home Financials are based on the most recent Mortgage that was taken out on this home.
Original Mortgage
$146,900
Outstanding Balance
$95,876
Interest Rate
5.31%
Mortgage Type
New Conventional
Estimated Equity
$398,750
Purchase Details
Closed on
Jun 25, 2009
Sold by
Morris Bryan
Bought by
Webster Bank National Association
Home Financials for this Owner
Home Financials are based on the most recent Mortgage that was taken out on this home.
Original Mortgage
$146,900
Outstanding Balance
$95,876
Interest Rate
5.31%
Mortgage Type
New Conventional
Estimated Equity
$398,750
Purchase Details
Closed on
Jul 31, 2006
Sold by
Morris Deborah
Bought by
Morris Bryan
Home Financials for this Owner
Home Financials are based on the most recent Mortgage that was taken out on this home.
Original Mortgage
$495,000
Interest Rate
6.56%
Mortgage Type
Construction
Create a Home Valuation Report for This Property
The Home Valuation Report is an in-depth analysis detailing your home's value as well as a comparison with similar homes in the area
Home Values in the Area
Average Home Value in this Area
Purchase History
We collect this data history from publicly available records. To have your information removed, we recommend requesting removal directly through your county’s website.
| Date | Buyer | Sale Price | Title Company |
|---|---|---|---|
| Eberson Susan | -- | None Available | |
| Eberson Jozef Z | $195,900 | The Talon Group Tempe Rural | |
| Webster Bank National Association | $199,000 | Fidelity National Title | |
| Morris Bryan | -- | First American Title Ins Co | |
| Morris Bryan | $215,000 | First American Title Ins Co |
Source: Public Records
Mortgage History
We collect this data history from publicly available records. To have your information removed, we recommend requesting removal directly through your county’s website.
| Date | Status | Borrower | Loan Amount |
|---|---|---|---|
| Open | Eberson Jozef Z | $146,900 | |
| Previous Owner | Morris Bryan | $495,000 |
Source: Public Records
Tax History
| Year | Tax Paid | Tax Assessment Tax Assessment Total Assessment is a certain percentage of the fair market value that is determined by local assessors to be the total taxable value of land and additions on the property. | Land | Improvement |
|---|---|---|---|---|
| 2025 | $2,151 | $25,869 | -- | -- |
| 2024 | $2,174 | $24,637 | -- | -- |
| 2023 | $2,174 | $45,410 | $9,080 | $36,330 |
| 2022 | $2,126 | $35,170 | $7,030 | $28,140 |
| 2021 | $2,185 | $33,200 | $6,640 | $26,560 |
| 2020 | $2,156 | $30,550 | $6,110 | $24,440 |
| 2019 | $1,997 | $28,320 | $5,660 | $22,660 |
| 2018 | $1,907 | $26,470 | $5,290 | $21,180 |
| 2017 | $1,847 | $24,580 | $4,910 | $19,670 |
| 2016 | $1,814 | $24,270 | $4,850 | $19,420 |
| 2015 | $1,713 | $22,080 | $4,410 | $17,670 |
Source: Public Records
Map
Nearby Homes
- 10223 E Billings St
- 460 N 104th St
- 10220 E Apache Trail Unit 52
- 10220 E Apache Trail Unit 217
- 10220 E Apache Trail Unit 213
- 146 N Merrill Rd Unit 71
- 146 N Merrill Rd Unit 54
- 146 N Merrill Rd Unit 21
- 146 N Merrill Rd Unit 20
- 146 N Merrill Rd Unit 2
- 146 N Merrill Rd Unit 107
- 146 N Merrill Rd Unit 151
- 146 N Merrill Rd Unit 73
- 146 N Merrill Rd Unit 68
- 146 N Merrill Rd Unit 155
- 9901 E Quarterline Rd
- 10411 E 1st St
- 10544 E Baltimore St
- 9822 E Main St Unit 21
- 9822 E Main St Unit 33
- 362 N Wesley
- 354 N Wesley
- 10214 E Baltimore St
- 347 N Chatsworth Cir
- 361 N Chatsworth Cir
- 346 N Wesley
- 10222 E Baltimore St
- 347 N Wesley
- 345 N Chatsworth Cir
- 338 N Wesley
- 348 N 102nd Place
- 339 N Wesley
- 10230 E Baltimore St
- 340 N 102nd Place
- 346 N Chatsworth Cir
- 330 N Wesley
- 325 N 101st Way
- 331 N Wesley
- 357 N 102nd Place
- 10143 E Cicero Cir
Your Personal Tour Guide
Ask me questions while you tour the home.