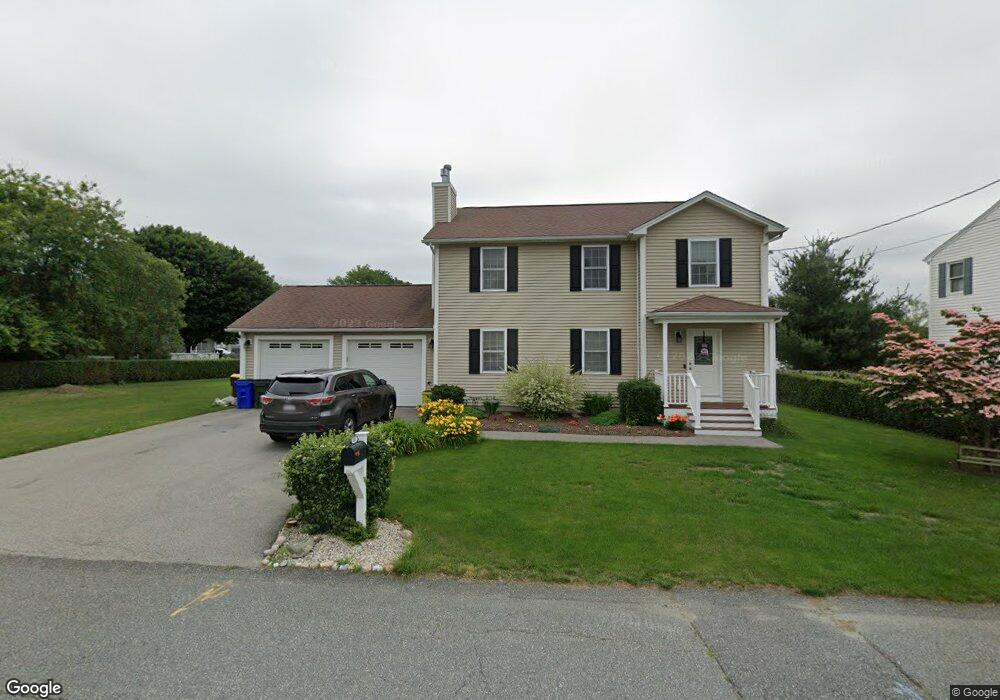
353 Rich St Fall River, MA 02720
Bank Street NeighborhoodEstimated Value: $539,349 - $576,000
3
Beds
3
Baths
1,952
Sq Ft
$283/Sq Ft
Est. Value
About This Home
This home is located at 353 Rich St, Fall River, MA 02720 and is currently estimated at $553,337, approximately $283 per square foot. 353 Rich St is a home with nearby schools including Spencer Borden Elementary School, Morton Middle School, and B M C Durfee High School.
Ownership History
Date
Name
Owned For
Owner Type
Purchase Details
Closed on
Jun 30, 2008
Sold by
Pires James J and Powers Marjorie
Bought by
Pacheco Amy L and Polak Robert D
Current Estimated Value
Home Financials for this Owner
Home Financials are based on the most recent Mortgage that was taken out on this home.
Original Mortgage
$120,000
Outstanding Balance
$77,416
Interest Rate
6.07%
Mortgage Type
Purchase Money Mortgage
Estimated Equity
$475,921
Create a Home Valuation Report for This Property
The Home Valuation Report is an in-depth analysis detailing your home's value as well as a comparison with similar homes in the area
Home Values in the Area
Average Home Value in this Area
Purchase History
| Date | Buyer | Sale Price | Title Company |
|---|---|---|---|
| Pacheco Amy L | $120,000 | -- |
Source: Public Records
Mortgage History
| Date | Status | Borrower | Loan Amount |
|---|---|---|---|
| Open | Pacheco Amy L | $120,000 |
Source: Public Records
Tax History
| Year | Tax Paid | Tax Assessment Tax Assessment Total Assessment is a certain percentage of the fair market value that is determined by local assessors to be the total taxable value of land and additions on the property. | Land | Improvement |
|---|---|---|---|---|
| 2025 | $5,277 | $460,900 | $143,200 | $317,700 |
| 2024 | $4,953 | $431,100 | $137,700 | $293,400 |
| 2023 | $5,145 | $419,300 | $123,600 | $295,700 |
| 2022 | $4,604 | $364,800 | $114,400 | $250,400 |
| 2021 | $4,688 | $339,000 | $108,100 | $230,900 |
| 2020 | $4,630 | $320,400 | $104,000 | $216,400 |
| 2019 | $4,550 | $312,100 | $104,000 | $208,100 |
| 2018 | $4,411 | $301,700 | $104,000 | $197,700 |
| 2017 | $4,179 | $298,500 | $104,000 | $194,500 |
| 2016 | $3,925 | $288,000 | $104,000 | $184,000 |
| 2015 | $3,736 | $285,600 | $97,300 | $188,300 |
| 2014 | $3,593 | $285,600 | $97,300 | $188,300 |
Source: Public Records
Map
Nearby Homes
- 36 Fordney St
- 295 Newbury St
- 168 Windsor St
- 677 Oak Grove Ave
- 742 New Boston Rd
- 243 Oak Grove Ave
- 108 Garden St
- 25 O'Hearn St
- 230 College Park Rd
- 27 Kane St
- 150 Downing St
- 201 Montgomery Cir
- 165 Eastern Ave
- 45-47 Shawmut St
- 10 Carlisa Dr
- 217 Plain St
- 218 Plain St
- 1231 Robeson St
- 992 Pine St
- 580 County St
Your Personal Tour Guide
Ask me questions while you tour the home.