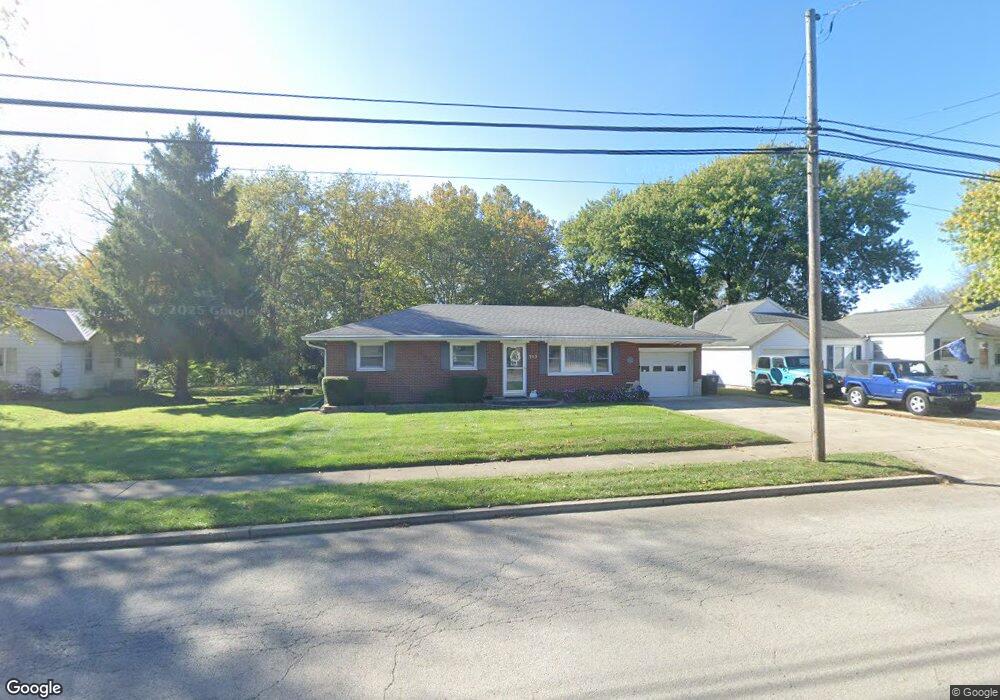
353 S High St Covington, OH 45318
Estimated Value: $228,000 - $249,000
3
Beds
1
Bath
1,768
Sq Ft
$134/Sq Ft
Est. Value
About This Home
This home is located at 353 S High St, Covington, OH 45318 and is currently estimated at $236,946, approximately $134 per square foot. 353 S High St is a home located in Miami County with nearby schools including Covington Elementary/Junior High School, Covington Junior High School, and Covington High School.
Ownership History
Date
Name
Owned For
Owner Type
Purchase Details
Closed on
Oct 27, 2015
Sold by
Bell Annette Kaye
Bought by
Wagoner Eric F and Wagoner Monica M
Current Estimated Value
Home Financials for this Owner
Home Financials are based on the most recent Mortgage that was taken out on this home.
Original Mortgage
$84,000
Outstanding Balance
$31,437
Interest Rate
3.82%
Mortgage Type
New Conventional
Estimated Equity
$205,509
Purchase Details
Closed on
Nov 17, 2004
Sold by
Bell Gary Lee
Bought by
Bell Gary Lee and Bell Annette Kaye
Purchase Details
Closed on
Sep 1, 1985
Bought by
Bell Gary Lee
Create a Home Valuation Report for This Property
The Home Valuation Report is an in-depth analysis detailing your home's value as well as a comparison with similar homes in the area
Home Values in the Area
Average Home Value in this Area
Purchase History
| Date | Buyer | Sale Price | Title Company |
|---|---|---|---|
| Wagoner Eric F | $120,000 | Attorney | |
| Bell Gary Lee | -- | -- | |
| Bell Gary Lee | -- | -- |
Source: Public Records
Mortgage History
| Date | Status | Borrower | Loan Amount |
|---|---|---|---|
| Open | Wagoner Eric F | $84,000 |
Source: Public Records
Tax History
| Year | Tax Paid | Tax Assessment Tax Assessment Total Assessment is a certain percentage of the fair market value that is determined by local assessors to be the total taxable value of land and additions on the property. | Land | Improvement |
|---|---|---|---|---|
| 2025 | $2,529 | $75,710 | $11,660 | $64,050 |
| 2024 | $2,529 | $59,150 | $12,600 | $46,550 |
| 2023 | $2,266 | $59,150 | $12,600 | $46,550 |
| 2022 | $2,260 | $59,150 | $12,600 | $46,550 |
| 2021 | $1,877 | $45,510 | $9,700 | $35,810 |
| 2020 | $1,881 | $45,510 | $9,700 | $35,810 |
| 2019 | $1,889 | $45,510 | $9,700 | $35,810 |
| 2018 | $1,509 | $36,260 | $7,560 | $28,700 |
| 2017 | $1,536 | $36,260 | $7,560 | $28,700 |
| 2016 | $1,517 | $36,260 | $7,560 | $28,700 |
| 2015 | $1,366 | $34,860 | $7,280 | $27,580 |
| 2014 | $1,366 | $34,860 | $7,280 | $27,580 |
| 2013 | $1,315 | $34,860 | $7,280 | $27,580 |
Source: Public Records
Map
Nearby Homes
Your Personal Tour Guide
Ask me questions while you tour the home.