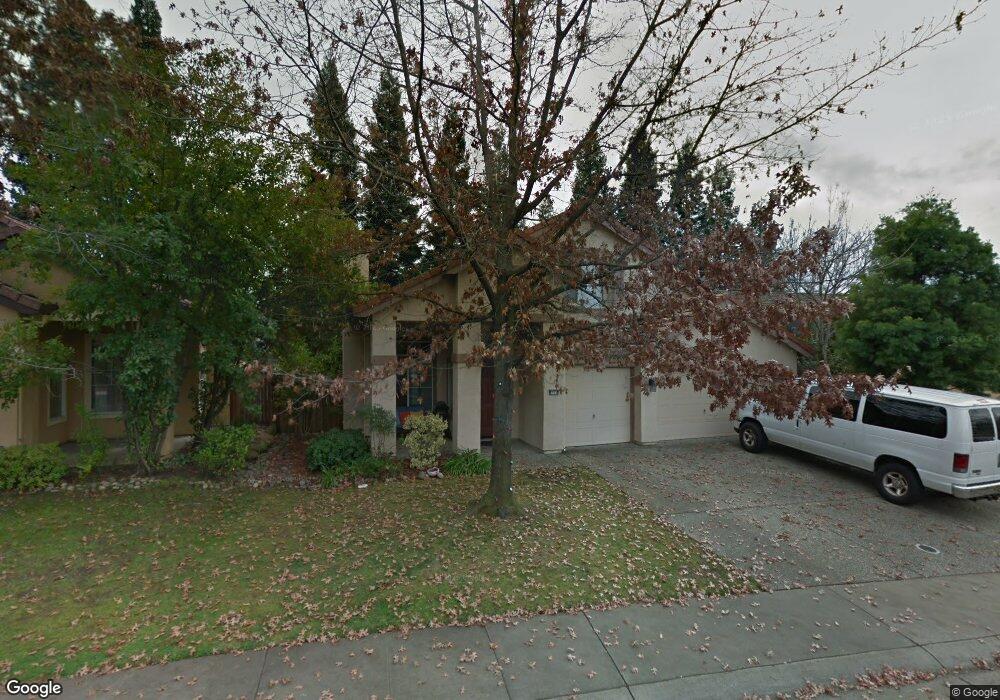
353 Seaton Dr Folsom, CA 95630
Natoma Station NeighborhoodEstimated Value: $614,000 - $787,000
4
Beds
2
Baths
2,161
Sq Ft
$326/Sq Ft
Est. Value
About This Home
This home is located at 353 Seaton Dr, Folsom, CA 95630 and is currently estimated at $704,019, approximately $325 per square foot. 353 Seaton Dr is a home located in Sacramento County with nearby schools including Natoma Station Elementary School, Sutter Middle School, and Folsom High School.
Ownership History
Date
Name
Owned For
Owner Type
Purchase Details
Closed on
Apr 28, 2017
Sold by
Khare Dhananjay and Khare Amita
Bought by
Khare Dhananjay and Khare Amita
Current Estimated Value
Purchase Details
Closed on
Aug 4, 1998
Sold by
Cresleigh Homes Corp
Bought by
Khare Dhananjay and Khare Amita
Home Financials for this Owner
Home Financials are based on the most recent Mortgage that was taken out on this home.
Original Mortgage
$159,450
Outstanding Balance
$33,293
Interest Rate
6.93%
Estimated Equity
$670,726
Create a Home Valuation Report for This Property
The Home Valuation Report is an in-depth analysis detailing your home's value as well as a comparison with similar homes in the area
Home Values in the Area
Average Home Value in this Area
Purchase History
We collect this data history from publicly available records. To have your information removed, we recommend requesting removal directly through your county’s website.
| Date | Buyer | Sale Price | Title Company |
|---|---|---|---|
| Khare Dhananjay | -- | None Available | |
| Khare Dhananjay | $199,500 | First American Title Ins Co |
Source: Public Records
Mortgage History
We collect this data history from publicly available records. To have your information removed, we recommend requesting removal directly through your county’s website.
| Date | Status | Borrower | Loan Amount |
|---|---|---|---|
| Open | Khare Dhananjay | $159,450 |
Source: Public Records
Tax History
| Year | Tax Paid | Tax Assessment Tax Assessment Total Assessment is a certain percentage of the fair market value that is determined by local assessors to be the total taxable value of land and additions on the property. | Land | Improvement |
|---|---|---|---|---|
| 2025 | $3,669 | $334,854 | $62,695 | $272,159 |
| 2024 | $3,669 | $328,289 | $61,466 | $266,823 |
| 2023 | $3,605 | $321,853 | $60,261 | $261,592 |
| 2022 | $3,554 | $315,543 | $59,080 | $256,463 |
| 2021 | $3,508 | $309,357 | $57,922 | $251,435 |
| 2020 | $3,466 | $306,186 | $57,329 | $248,857 |
| 2019 | $3,410 | $300,183 | $56,205 | $243,978 |
| 2018 | $3,328 | $294,298 | $55,103 | $239,195 |
| 2017 | $4,276 | $288,528 | $54,023 | $234,505 |
| 2016 | $4,455 | $282,871 | $52,964 | $229,907 |
| 2015 | $4,336 | $278,623 | $52,169 | $226,454 |
| 2014 | $4,166 | $273,167 | $51,148 | $222,019 |
Source: Public Records
Map
Nearby Homes
- 110 Conductor Way
- 339 Coventry Cir
- 396 Seaton Dr
- 401 Seaton Dr
- 100 Bayline Cir
- 187 John Henry Cir
- 130 Bayline Cir
- 145 Hopfield Dr
- 146 Orange Blossom Cir Unit C
- 2702 Ferry Cir Unit 102
- 632 Fisher Cir
- 756 Silo St
- 124 Sutcliffe Cir
- 447 Gem Smith Place
- 451 Jewel Stone Way
- 110 Royalton Cir
- 112 Royalton Cir
- 1002 Sibley St Unit 25
- 701 Ferrier Way
- 706 Ward Way
- 355 Seaton Dr
- 351 Seaton Dr
- 357 Seaton Dr
- 412 Wellsley Ct
- 413 Wellsley Ct
- 359 Seaton Dr
- 416 Wellsley Ct
- 417 Wellsley Ct
- 358 Seaton Dr
- 361 Seaton Dr
- 420 Wellsley Ct
- 421 Wellsley Ct
- 411 Amhurst Cir
- 363 Seaton Dr
- 383 Coventry Cir
- 413 Amhurst Cir
- 381 Coventry Cir
- 415 Amhurst Cir
- 425 Wellsley Ct
- 385 Coventry Cir
Your Personal Tour Guide
Ask me questions while you tour the home.