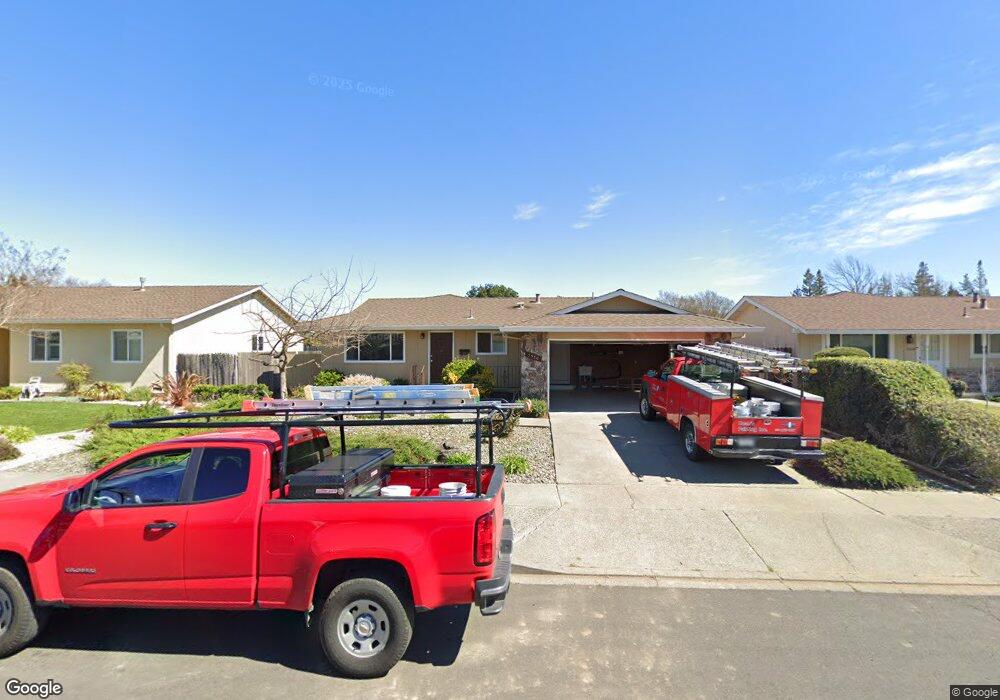
3530 Cascade St Napa, CA 94558
Vintage NeighborhoodEstimated Value: $719,909 - $845,000
3
Beds
2
Baths
1,441
Sq Ft
$546/Sq Ft
Est. Value
About This Home
This home is located at 3530 Cascade St, Napa, CA 94558 and is currently estimated at $786,727, approximately $545 per square foot. 3530 Cascade St is a home located in Napa County with nearby schools including Bel Aire Park Elementary School, Redwood Middle School, and Vintage High School.
Ownership History
Date
Name
Owned For
Owner Type
Purchase Details
Closed on
Jul 16, 2012
Sold by
Bunnell Daniel H and Bunnell Catherine M
Bought by
Bunnell Daniel H and Bunnell Catherine M
Current Estimated Value
Purchase Details
Closed on
Feb 15, 2012
Sold by
Aurora Loan Services Llc
Bought by
Bunnell Daniel and Bunnell Catherine
Purchase Details
Closed on
Jun 23, 2011
Sold by
Bussa Sokolay Philip G and Bussa Sokolay Beverly
Bought by
Aurora Loan Services Llc
Purchase Details
Closed on
Dec 15, 1998
Sold by
Bussa Edward J and Bussa Sokolay Beverly
Bought by
Bussa Sokolay Philip G and Bussa Sokolay Beverly
Home Financials for this Owner
Home Financials are based on the most recent Mortgage that was taken out on this home.
Original Mortgage
$97,300
Interest Rate
6.86%
Purchase Details
Closed on
Oct 31, 1996
Sold by
Bussa Elsie
Bought by
Bussa Elsie and The Elsie Bussa Revocable Trus
Purchase Details
Closed on
Nov 3, 1994
Sold by
Bussa Tillio and Bussa Elsie
Bought by
Bussa Edward J and Bussa Beverly M
Create a Home Valuation Report for This Property
The Home Valuation Report is an in-depth analysis detailing your home's value as well as a comparison with similar homes in the area
Home Values in the Area
Average Home Value in this Area
Purchase History
| Date | Buyer | Sale Price | Title Company |
|---|---|---|---|
| Bunnell Daniel H | -- | None Available | |
| Bunnell Daniel | $291,000 | Lsi Title Company | |
| Aurora Loan Services Llc | $283,000 | Accommodation | |
| Bussa Sokolay Philip G | -- | First California Title Co | |
| Bussa Elsie | -- | -- | |
| Bussa Elsie | -- | -- | |
| Bussa Tilio | -- | -- | |
| Bussa Edward J | -- | -- |
Source: Public Records
Mortgage History
| Date | Status | Borrower | Loan Amount |
|---|---|---|---|
| Previous Owner | Bussa Sokolay Philip G | $97,300 |
Source: Public Records
Tax History
| Year | Tax Paid | Tax Assessment Tax Assessment Total Assessment is a certain percentage of the fair market value that is determined by local assessors to be the total taxable value of land and additions on the property. | Land | Improvement |
|---|---|---|---|---|
| 2025 | $4,918 | $365,498 | $150,720 | $214,778 |
| 2024 | $4,772 | $358,332 | $147,765 | $210,567 |
| 2023 | $4,772 | $351,307 | $144,868 | $206,439 |
| 2022 | $4,640 | $344,420 | $142,028 | $202,392 |
| 2021 | $4,580 | $337,668 | $139,244 | $198,424 |
| 2020 | $4,548 | $334,207 | $137,817 | $196,390 |
| 2019 | $4,449 | $327,655 | $135,115 | $192,540 |
| 2018 | $4,379 | $321,231 | $132,466 | $188,765 |
| 2017 | $4,281 | $314,933 | $129,869 | $185,064 |
| 2016 | $4,169 | $308,759 | $127,323 | $181,436 |
| 2015 | $3,889 | $304,122 | $125,411 | $178,711 |
| 2014 | $3,828 | $298,166 | $122,955 | $175,211 |
Source: Public Records
Map
Nearby Homes
- 3429 Willis Dr
- 3557 Jefferson St
- 3575 Jefferson St
- 20 Walkabout Ln
- 2250 Vandeleur Dr
- 5 Blackberry Dr
- 2243 Vandeleur Dr
- 2298 Vandeleur Dr
- 3538 Baxter Ave
- 3739 Parrett Ave
- 10 Summerbrooke Cir
- 113 Firefly Ln
- 111 Firefly Ln
- 3495 Valle Verde Dr
- 10 Culbertson Ct
- 3654 Diablo St
- 71 Valley Club Cir
- 3476 Shelter Creek Dr
- 3552 Shelter Creek Dr
- 3612 Idlewild Ave
- 3536 Cascade St Unit 2
- 3515 Mariposa Ct
- 3542 Cascade St
- 3523 Mariposa Ct
- 3518 Cascade St
- 3507 Mariposa Ct
- 3535 Mariposa Ct
- 3529 Cascade St
- 3535 Cascade St
- 3525 Cascade St
- 3548 Cascade St
- 3512 Cascade St
- 3541 Cascade St
- 3543 Mariposa Ct
- 3517 Cascade St
- 1222 Rubicon St
- 3547 Cascade St
- 3554 Cascade St
- 3555 Mariposa Ct
- 3511 Cascade St
Your Personal Tour Guide
Ask me questions while you tour the home.