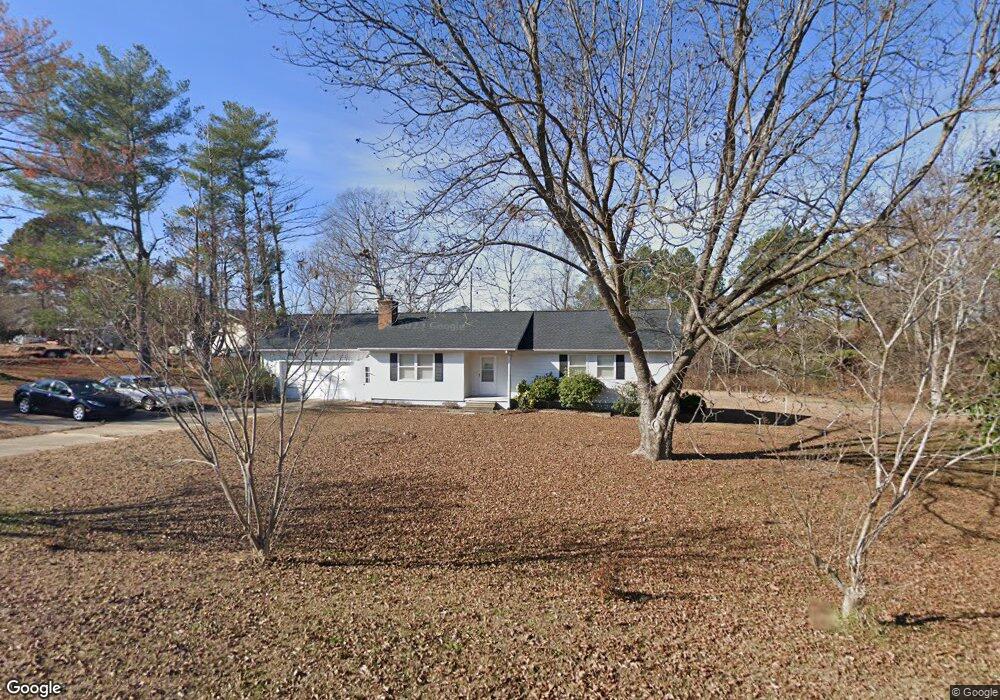
3530 Parrish Farm Rd Garner, NC 27529
Estimated Value: $378,638 - $444,000
Studio
2
Baths
1,783
Sq Ft
$229/Sq Ft
Est. Value
About This Home
This home is located at 3530 Parrish Farm Rd, Garner, NC 27529 and is currently estimated at $408,910, approximately $229 per square foot. 3530 Parrish Farm Rd is a home located in Wake County with nearby schools including Aversboro Elementary, North Garner Middle, and South Garner High.
Ownership History
Date
Name
Owned For
Owner Type
Purchase Details
Closed on
Mar 12, 2024
Sold by
Thornton John Daniel and Thornton Debra C
Bought by
Forsyth Development & Investment Company Llc
Current Estimated Value
Purchase Details
Closed on
Sep 25, 2018
Sold by
Thornton James F and Thornton John Daniel
Bought by
Thornton James F and Thornton John Daniel
Purchase Details
Closed on
Oct 18, 2016
Sold by
Thornton James Franklin
Bought by
Thornton John Daniel and Thornton Wanda S
Purchase Details
Closed on
Dec 3, 1998
Sold by
Broughton David Neal
Bought by
Thornton James F and Thornton Kathryn M
Home Financials for this Owner
Home Financials are based on the most recent Mortgage that was taken out on this home.
Original Mortgage
$81,900
Interest Rate
6.77%
Create a Home Valuation Report for This Property
The Home Valuation Report is an in-depth analysis detailing your home's value as well as a comparison with similar homes in the area
Home Values in the Area
Average Home Value in this Area
Purchase History
| Date | Buyer | Sale Price | Title Company |
|---|---|---|---|
| Forsyth Development & Investment Company Llc | $536,000 | None Listed On Document | |
| Forsyth Development & Investment Company Llc | $536,000 | None Listed On Document | |
| Thornton James F | -- | None Available | |
| Thornton John Daniel | $2,000 | None Available | |
| Thornton John Daniel | -- | None Listed On Document | |
| Thornton James F | -- | None Available | |
| Thornton James F | $96,500 | -- |
Source: Public Records
Mortgage History
| Date | Status | Borrower | Loan Amount |
|---|---|---|---|
| Previous Owner | Thornton James F | $81,900 |
Source: Public Records
Tax History
| Year | Tax Paid | Tax Assessment Tax Assessment Total Assessment is a certain percentage of the fair market value that is determined by local assessors to be the total taxable value of land and additions on the property. | Land | Improvement |
|---|---|---|---|---|
| 2025 | $3,373 | $157,840 | $133,294 | $24,546 |
| 2024 | $2,028 | $323,335 | $91,000 | $232,335 |
Source: Public Records
Map
Nearby Homes
- 101 Brody Pine Way
- 7301 Cleveland School Rd
- 5441 Fantasy Moth Dr
- 3760 Wakefield Ln
- 115 Birdie Dr
- 106 Par Cir
- 6313 Brack Penny Rd
- 313 Belve Dr
- 1017 Southern Trace Trail
- 5412 Treebound Ct
- 1004 Snow Peak Ct
- 5405 Massengill Ct
- 1001 Retriever Ln
- 6500 Egrets Nest Ln
- 562 Pierce Rd
- 15 Crest Cir
- 245 Marsh Creek Dr
- 198 Outwater Ridge Dr
- 188 Outwater Ridge Dr
- 1205 Magnolia Hill Rd
- 3540 Parrish Farm Rd
- 7001 Cleveland School Rd
- 5429 Cleveland School Rd
- 5419 Cleveland School Rd
- 7025 Cleveland School Rd
- 7025 Cleveland School Rd Unit 5600 Painters Rd ACT
- 1109 Open Field Dr
- 6929 Stevens Oaks Dr
- 1105 Open Field Dr
- 1113 Open Field Dr
- 5600 Painters Rd
- 1213 Open Field Dr
- 1117 Open Field Dr
- 1217 Open Field Dr
- 4024 Benson Rd
- 1209 Open Field Dr
- 1221 Open Field Dr
- 1225 Open Field Dr
- 1101 Open Field Dr
- 4020 Benson Rd
Your Personal Tour Guide
Ask me questions while you tour the home.