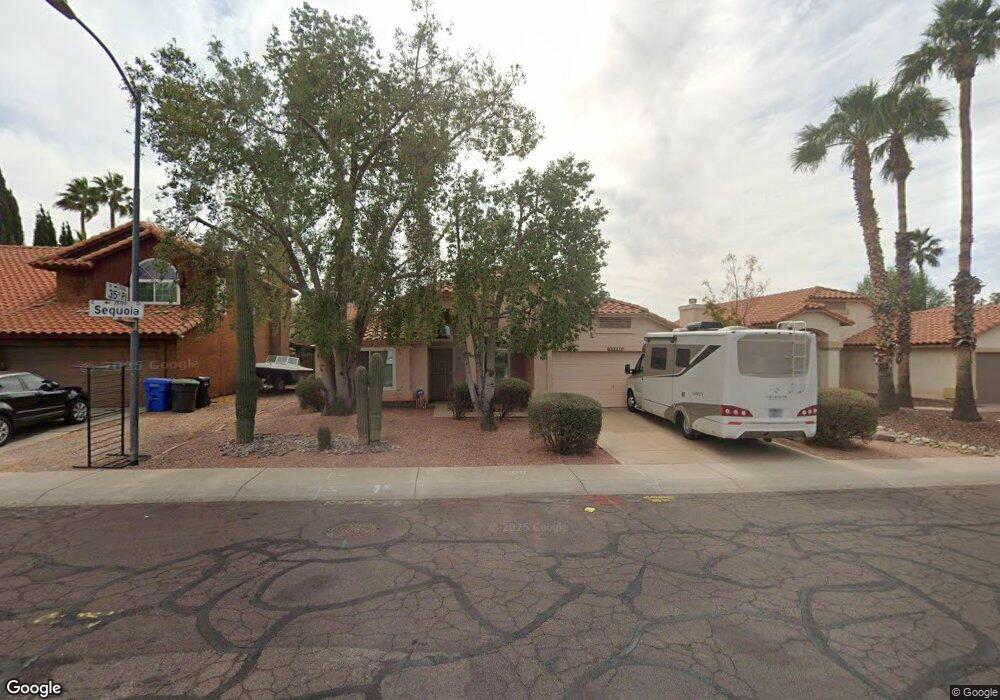
3531 E Sequoia Dr Phoenix, AZ 85050
Paradise Valley Village NeighborhoodEstimated Value: $430,151 - $564,000
3
Beds
2
Baths
1,551
Sq Ft
$335/Sq Ft
Est. Value
About This Home
This home is located at 3531 E Sequoia Dr, Phoenix, AZ 85050 and is currently estimated at $520,288, approximately $335 per square foot. 3531 E Sequoia Dr is a home located in Maricopa County with nearby schools including Quail Run Elementary School, Sunrise Middle School, and Paradise Valley High School.
Ownership History
Date
Name
Owned For
Owner Type
Purchase Details
Closed on
Mar 21, 2001
Sold by
Copelan Lynda W
Bought by
Hommel Suzanne
Current Estimated Value
Home Financials for this Owner
Home Financials are based on the most recent Mortgage that was taken out on this home.
Original Mortgage
$130,000
Outstanding Balance
$47,478
Interest Rate
7.06%
Mortgage Type
New Conventional
Estimated Equity
$472,810
Purchase Details
Closed on
Oct 5, 1998
Sold by
Barrett Charles L
Bought by
Copelan Lynda W
Purchase Details
Closed on
Sep 4, 1998
Sold by
Wolf Steven T and Wolf Jamie J
Bought by
Copelan Lynda W
Purchase Details
Closed on
Mar 21, 1995
Sold by
Evans Michael J and Evans Trishia E
Bought by
Wolf Steven T and Wolf Jamie J
Home Financials for this Owner
Home Financials are based on the most recent Mortgage that was taken out on this home.
Original Mortgage
$123,650
Interest Rate
7.12%
Mortgage Type
New Conventional
Purchase Details
Closed on
Jun 1, 1994
Sold by
Evans John P
Bought by
Evans Michael J and Evans Trishia E
Create a Home Valuation Report for This Property
The Home Valuation Report is an in-depth analysis detailing your home's value as well as a comparison with similar homes in the area
Home Values in the Area
Average Home Value in this Area
Purchase History
| Date | Buyer | Sale Price | Title Company |
|---|---|---|---|
| Hommel Suzanne | $169,900 | Fidelity National Title | |
| Copelan Lynda W | -- | Equity Title Agency | |
| Copelan Lynda W | $144,900 | Equity Title Agency | |
| Wolf Steven T | $130,200 | Chicago Title Insurance Co | |
| Evans Michael J | -- | -- | |
| Evans Michael J | -- | -- |
Source: Public Records
Mortgage History
| Date | Status | Borrower | Loan Amount |
|---|---|---|---|
| Open | Hommel Suzanne | $130,000 | |
| Previous Owner | Wolf Steven T | $123,650 |
Source: Public Records
Tax History
| Year | Tax Paid | Tax Assessment Tax Assessment Total Assessment is a certain percentage of the fair market value that is determined by local assessors to be the total taxable value of land and additions on the property. | Land | Improvement |
|---|---|---|---|---|
| 2025 | $2,178 | $25,154 | -- | -- |
| 2024 | $2,074 | $23,956 | -- | -- |
| 2023 | $2,074 | $38,180 | $7,630 | $30,550 |
| 2022 | $2,055 | $28,360 | $5,670 | $22,690 |
| 2021 | $2,088 | $26,620 | $5,320 | $21,300 |
| 2020 | $2,017 | $25,120 | $5,020 | $20,100 |
| 2019 | $2,026 | $23,860 | $4,770 | $19,090 |
| 2018 | $1,952 | $21,530 | $4,300 | $17,230 |
| 2017 | $1,864 | $20,500 | $4,100 | $16,400 |
| 2016 | $1,835 | $20,300 | $4,060 | $16,240 |
Source: Public Records
Map
Nearby Homes
- 3569 E Utopia Rd
- 3525 E Wickieup Ln
- 3542 E Kerry Ln
- 3611 E Kristal Way
- 3426 E Clark Rd
- 3318 E Taro Ln
- 3239 E Sequoia Dr
- 3206 E Kristal Way
- 3407 E Escuda Rd
- 3212 E Tonto Ln
- 3401 E Menadota Dr
- 20007 N 33rd St
- 3114 E Kristal Way
- 3930 E Wescott Dr
- 19802 N 32nd St Unit 142
- 19802 N 32nd St Unit 144
- 19802 N 32nd St Unit 169
- 19802 N 32nd St Unit 65
- 19802 N 32nd St Unit 73
- 19602 N 32nd St Unit 129
- 3537 E Sequoia Dr
- 3525 E Sequoia Dr
- 3532 E Utopia Rd
- 3543 E Sequoia Dr
- 3526 E Utopia Rd
- 3519 E Sequoia Dr
- 3538 E Utopia Rd
- 3520 E Utopia Rd
- 3544 E Utopia Rd
- 3526 E Sequoia Dr
- 19429 N 35th Place
- 3549 E Sequoia Dr
- 3513 E Sequoia Dr
- 3520 E Sequoia Dr
- 3514 E Utopia Rd
- 3514 E Sequoia Dr
- 19435 N 35th Place
- 3507 E Sequoia Dr
- 19430 N 36th St
- 3555 E Sequoia Dr
Your Personal Tour Guide
Ask me questions while you tour the home.