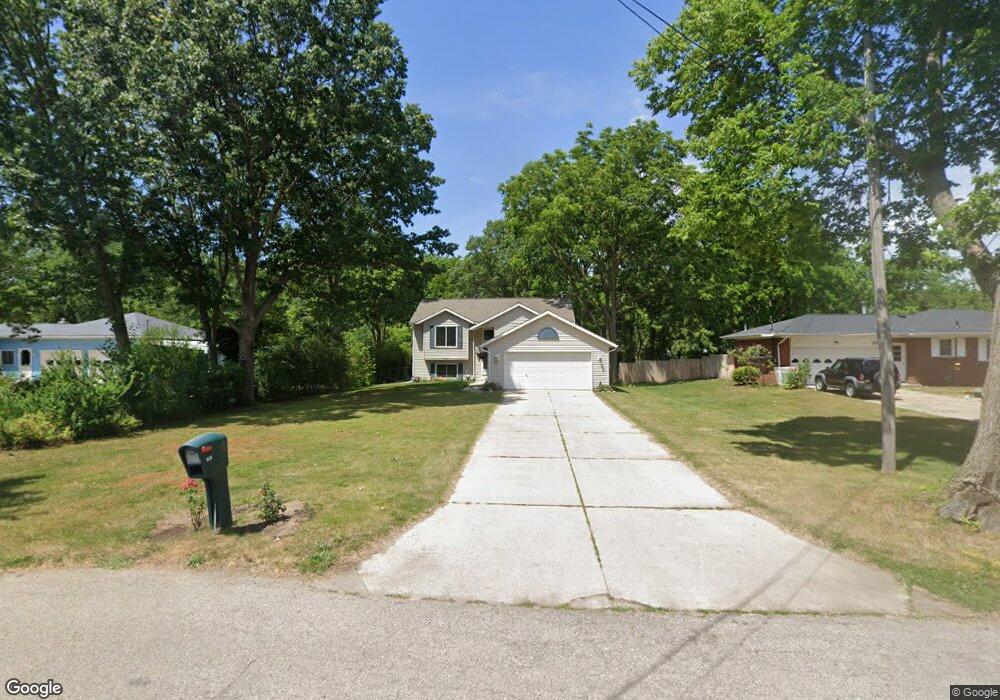
3531 Eastern Ave NE Grand Rapids, MI 49525
Northview NeighborhoodEstimated Value: $321,000 - $385,000
4
Beds
2
Baths
1,600
Sq Ft
$222/Sq Ft
Est. Value
About This Home
This home is located at 3531 Eastern Ave NE, Grand Rapids, MI 49525 and is currently estimated at $354,784, approximately $221 per square foot. 3531 Eastern Ave NE is a home located in Kent County with nearby schools including North Park Montessori Academy, Riverside Middle School, and Union High School.
Ownership History
Date
Name
Owned For
Owner Type
Purchase Details
Closed on
Feb 23, 2024
Sold by
Jacobus Donders and Jacobus Arlene Nelson-Donder
Bought by
Molitor Brandi Renee and Marzolino Ian
Current Estimated Value
Home Financials for this Owner
Home Financials are based on the most recent Mortgage that was taken out on this home.
Original Mortgage
$251,250
Outstanding Balance
$246,801
Interest Rate
6.6%
Mortgage Type
New Conventional
Estimated Equity
$107,983
Purchase Details
Closed on
Nov 6, 2020
Sold by
Donders Jacobus A and Nelson Donders Arlene
Bought by
Donders Jacobus and Nelson Donders Arlene
Purchase Details
Closed on
Jun 22, 2000
Bought by
Dndrs Dndrs J and Dndrs A
Purchase Details
Closed on
Nov 27, 1995
Sold by
Bosgraf Co and Bosgraf Kaminski
Bought by
Donders Kaminski and Donders Jacobus A
Purchase Details
Closed on
May 5, 1995
Sold by
Niedzwiecki Niedzwiecki D D and Niedzwiecki Bsgraf
Bought by
Donders Bsgraf and Donders Jacobus A
Create a Home Valuation Report for This Property
The Home Valuation Report is an in-depth analysis detailing your home's value as well as a comparison with similar homes in the area
Home Values in the Area
Average Home Value in this Area
Purchase History
| Date | Buyer | Sale Price | Title Company |
|---|---|---|---|
| Molitor Brandi Renee | $335,000 | Grand Rapids Title | |
| Donders Jacobus | -- | None Available | |
| Dndrs Dndrs J | $133,500 | -- | |
| Donders Kaminski | $100,400 | -- | |
| Donders Bsgraf | $20,000 | -- |
Source: Public Records
Mortgage History
| Date | Status | Borrower | Loan Amount |
|---|---|---|---|
| Open | Molitor Brandi Renee | $251,250 |
Source: Public Records
Tax History Compared to Growth
Tax History
| Year | Tax Paid | Tax Assessment Tax Assessment Total Assessment is a certain percentage of the fair market value that is determined by local assessors to be the total taxable value of land and additions on the property. | Land | Improvement |
|---|---|---|---|---|
| 2025 | $2,429 | $165,900 | $0 | $0 |
| 2024 | $2,429 | $148,300 | $0 | $0 |
| 2023 | $2,464 | $127,600 | $0 | $0 |
| 2022 | $2,335 | $121,000 | $0 | $0 |
| 2021 | $134 | $100,300 | $0 | $0 |
| 2020 | $2,187 | $94,700 | $0 | $0 |
| 2019 | $2,290 | $86,500 | $0 | $0 |
| 2018 | $2,212 | $72,800 | $0 | $0 |
| 2017 | $2,153 | $72,400 | $0 | $0 |
| 2016 | $2,179 | $68,200 | $0 | $0 |
| 2015 | $2,027 | $68,200 | $0 | $0 |
| 2013 | -- | $59,600 | $0 | $0 |
Source: Public Records
Map
Nearby Homes
- 3649 Coit Ave NE
- 3776 Eastern Ave NE
- 1030 4 Mile Rd NE
- 3544 Briggs Blvd NE
- 3261 Essex St NE
- 3836 Standish Ave NE
- 408 Elmdale St NE
- 3785 Willow Dr NE
- 4005 Filkins Dr NE
- 3151 Kendalwood Ct NE
- 3903 Willow Dr NE
- 3661 Willow Dr NE
- 3750 Benjamin Ave NE
- 3030 Plainfield Ave NE
- 1444 Mark St NE
- 2905 Remy Ct NE Unit 1
- 648 Russwood St NE
- 661 Conger St NE
- 1710 Kreft St NE
- 518 Russwood St NE
- 3543 Eastern Ave NE
- 3521 Eastern Ave NE
- 772 4 Mile Rd NE
- 3515 Eastern Ave NE
- 3540 Eastern Ave NE
- 768 4 Mile Rd NE
- 3524 Eastern Ave NE
- 3552 Eastern Ave NE
- 758 4 Mile Rd NE
- 3520 Eastern Ave NE
- 3501 Eastern Ave NE
- 820 4 Mile Rd NE
- 3512 Eastern Ave NE
- 3543 Williamson Ave NE
- 3551 Williamson Ave NE
- 738 4 Mile Rd NE
- 3519 Williamson Ave NE
- 3504 Eastern Ave NE
- 765 4 Mile Rd NE
- 3615 Eastern Ave NE