

3531 Ocean Front Walk San Diego, CA 92109
Mission Beach NeighborhoodEstimated Value: $2,537,000 - $2,769,000
3
Beds
2
Baths
1,256
Sq Ft
$200/mo
HOA Fee
Highlights
- 0.1 Acre Lot
- Private Yard
- Laundry Room
- Pacific Beach Elementary School Rated A-
- Living Room
- Outdoor Grill
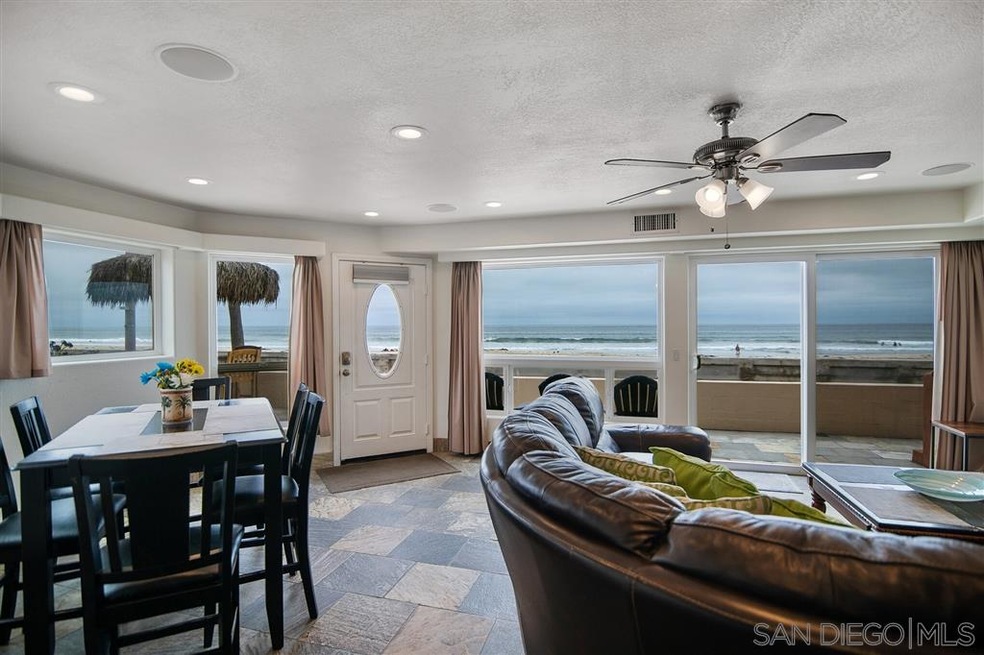
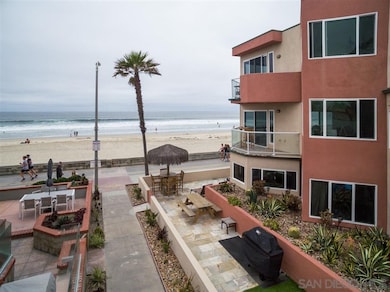
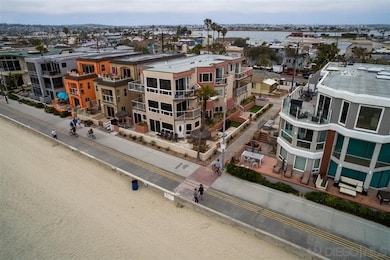
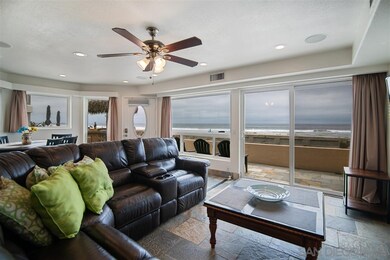
About This Home
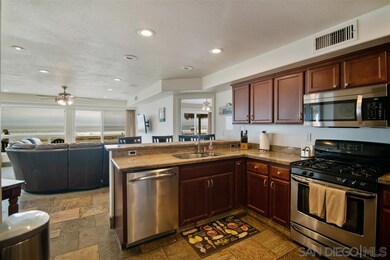
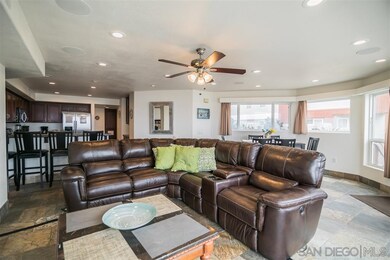
As of July 2019On the waterfront! Ground-floor 3 bedroom condo with exclusive-use patio, palapas & BBQ. Ocean views from living room, kitchen, & all bedrooms! Heart of Mission Beach, where the peninsula is most narrow. Less properties, less people. Full 2-car carport with direct access to unit. Low HOA dues ($200),s olar panels keeps utility bill low, separately metered water= Very efficient condo. Currently used a vacation rental with approx $125 income. Would also make a great home or 2nd home. Click Video Tour Link
Property Details
Home Type
- Condominium
Est. Annual Taxes
- $27,431
Year Built
- Built in 2005
Lot Details
- Property is Fully Fenced
- Private Yard
HOA Fees
- $200 Monthly HOA Fees
Home Design
- Rolled or Hot Mop Roof
- Stucco Exterior
Interior Spaces
- 1,256 Sq Ft Home
- 3-Story Property
- Living Room
- Dining Area
- Dishwasher
Bedrooms and Bathrooms
- 3 Bedrooms
- 2 Full Bathrooms
Laundry
- Laundry Room
- Gas Dryer Hookup
Parking
- 2 Parking Spaces
- Carport
- Tandem Garage
Additional Features
- Outdoor Grill
- Separate Water Meter
Community Details
- Association fees include exterior bldg maintenance, limited insurance
- 3 Units
- Inquiry With Agent Association
- Monterey Hoa Community
Listing and Financial Details
- Assessor Parcel Number 423-614-03-01
Ownership History
Date
Name
Owned For
Owner Type
Purchase Details
Closed on
Oct 25, 2022
Sold by
Decker Trina and Decker John
Bought by
Decker Family Trust
Total Days on Market
1
Current Estimated Value
Purchase Details
Listed on
Jun 6, 2019
Closed on
Jun 11, 2019
Sold by
Foster William James and Foster Generation Skipping Tra
Bought by
Decker Trina and Decker John
Seller's Agent
Bob Ruane
Compass
Buyer's Agent
Kimberly Wise
Compass
List Price
$2,095,000
Sold Price
$2,080,000
Premium/Discount to List
-$15,000
-0.72%
Home Financials for this Owner
Home Financials are based on the most recent Mortgage that was taken out on this home.
Avg. Annual Appreciation
2.67%
Original Mortgage
$1,664,000
Interest Rate
3.82%
Mortgage Type
New Conventional
Purchase Details
Listed on
Nov 24, 2014
Closed on
Jun 23, 2015
Sold by
Foster Winslow James
Bought by
Foster Winslow James
Seller's Agent
Brian Yui
houserebate.com
Buyer's Agent
Carlos Aguilar
Axia Real Estate Group, Inc
List Price
$1,410,000
Sold Price
$1,410,000
Home Financials for this Owner
Home Financials are based on the most recent Mortgage that was taken out on this home.
Avg. Annual Appreciation
9.95%
Purchase Details
Listed on
Nov 24, 2014
Closed on
May 7, 2015
Sold by
Rinaldi Sharon A
Bought by
Foster Winslow James
Seller's Agent
Brian Yui
houserebate.com
Buyer's Agent
Carlos Aguilar
Axia Real Estate Group, Inc
List Price
$1,410,000
Sold Price
$1,410,000
Purchase Details
Closed on
Oct 17, 2005
Sold by
Mission Beach Developers Inc
Bought by
Rinaldi Sharon A
Home Financials for this Owner
Home Financials are based on the most recent Mortgage that was taken out on this home.
Original Mortgage
$320,000
Interest Rate
5.49%
Mortgage Type
Stand Alone Second
Create a Home Valuation Report for This Property
The Home Valuation Report is an in-depth analysis detailing your home's value as well as a comparison with similar homes in the area
Similar Homes in the area
Home Values in the Area
Average Home Value in this Area
Purchase History
| Date | Buyer | Sale Price | Title Company |
|---|---|---|---|
| Decker Family Trust | -- | -- | |
| Decker Trina | $2,080,000 | Chicago Title Company | |
| Foster Winslow James | -- | Corinthian Title Company Inc | |
| Foster Winslow James | $1,410,000 | Ticor Title | |
| Rinaldi Sharon A | $1,650,000 | Chicago Title Co |
Source: Public Records
Mortgage History
| Date | Status | Borrower | Loan Amount |
|---|---|---|---|
| Previous Owner | Decker Trina | $1,647,000 | |
| Previous Owner | Decker Trina | $1,664,000 | |
| Previous Owner | Rinaldi Sharon A | $250,000 | |
| Previous Owner | Rinaldi Sharon A | $150,000 | |
| Previous Owner | Rinaldi Sharon A | $1,400,000 | |
| Previous Owner | Rinaldi Sharon A | $320,000 |
Source: Public Records
Property History
| Date | Event | Price | Change | Sq Ft Price |
|---|---|---|---|---|
| 07/18/2019 07/18/19 | Sold | $2,080,000 | -0.7% | $1,656 / Sq Ft |
| 06/08/2019 06/08/19 | Pending | -- | -- | -- |
| 06/06/2019 06/06/19 | For Sale | $2,095,000 | +48.6% | $1,668 / Sq Ft |
| 06/12/2015 06/12/15 | Sold | $1,410,000 | 0.0% | $1,123 / Sq Ft |
| 06/03/2015 06/03/15 | Pending | -- | -- | -- |
| 11/24/2014 11/24/14 | For Sale | $1,410,000 | -- | $1,123 / Sq Ft |
Source: San Diego MLS
Tax History Compared to Growth
Tax History
| Year | Tax Paid | Tax Assessment Tax Assessment Total Assessment is a certain percentage of the fair market value that is determined by local assessors to be the total taxable value of land and additions on the property. | Land | Improvement |
|---|---|---|---|---|
| 2024 | $27,431 | $2,230,176 | $1,956,768 | $273,408 |
| 2023 | $26,828 | $2,186,448 | $1,918,400 | $268,048 |
| 2022 | $26,114 | $2,143,578 | $1,880,785 | $262,793 |
| 2021 | $25,934 | $2,101,548 | $1,843,907 | $257,641 |
| 2020 | $25,619 | $2,080,000 | $1,825,000 | $255,000 |
| 2019 | $18,754 | $1,519,118 | $1,238,998 | $280,120 |
| 2018 | $17,532 | $1,489,332 | $1,214,704 | $274,628 |
| 2017 | $17,122 | $1,460,131 | $1,190,887 | $269,244 |
| 2016 | $16,852 | $1,431,502 | $1,167,537 | $263,965 |
| 2015 | $18,835 | $1,600,000 | $1,360,000 | $240,000 |
| 2014 | $17,724 | $1,500,000 | $1,275,000 | $225,000 |
Source: Public Records
Agents Affiliated with this Home
-
Bob Ruane
Seller's Agent in 2019
Bob Ruane
Compass
19 in this area
32 Total Sales
-
Kimberly Wise
Buyer's Agent in 2019
Kimberly Wise
Compass
(858) 736-7435
5 in this area
8 Total Sales
-
Brian Yui
Seller's Agent in 2015
Brian Yui
houserebate.com
(760) 576-4580
37 Total Sales
-
Buyer's Agent in 2015
Carlos Aguilar
Axia Real Estate Group, Inc
(619) 743-4118
13 Total Sales
-
L
Buyer's Agent in 2015
Lisa Tsang
Landmark Investment Inc.
-
William Tsang
W
Buyer's Agent in 2015
William Tsang
Landmark Investment Inc.
4 Total Sales
Map
Source: San Diego MLS
MLS Number: 190031116
APN: 423-614-03-01
Disclaimer: Certain information contained herein is derived from information provided by parties other than Homes.com. All information provided is deemed reliable, but is not guaranteed to be accurate and should be independently verified.
![]() This information is deemed reliable but not guaranteed. You should rely on this information only to decide whether or not to further investigate a particular property.
This information is deemed reliable but not guaranteed. You should rely on this information only to decide whether or not to further investigate a particular property.
BEFORE MAKING ANY OTHER DECISION, YOU SHOULD PERSONALLY INVESTIGATE THE FACTS (e.g. square footage and lot size) with the assistance of an appropriate professional. You may use this information only to identify properties you may be interested in investigating further. All uses except for personal, noncommercial use in accordance with the foregoing purpose are prohibited. Redistribution or copying of this information, any photographs or video tours is strictly
prohibited. This information is derived from the Internet Data Exchange (IDX) service provided by San Diego MLS. Displayed property listings may be held by a brokerage firm other than the broker and/or agent responsible for this display. The information and any photographs and video tours and the compilation from which they are derived is protected by copyright. Compilation © 2025 San Diego MLS.
Nearby Homes
- 3581 Mission Blvd
- 3536-40 Bayside Walk
- 719 Manhattan Ct Unit 21
- 815 Manhattan Ct
- 817-817 1/2 Ormond Ct
- 720 San Luis Obispo Place Unit D
- 3656 Bayside Walk
- 814 Kingston Ct
- 3719 Mission Blvd
- 821 Portsmouth Ct Unit E
- 811 Kennebeck Ct
- 819 Kennebeck Ct
- 3750 Bayside Walk Unit 6
- 826 Jersey Ct
- 810 Santa Barbara Place
- 3756-58 Mission Blvd Unit H,I,J,K,L
- 801 Salem Ct Unit 25
- 3255 Ocean Front Walk
- 715 Toulon Ct
- 810 Vanitie Ct
- 3531 Ocean Front Walk
- 704 Monterey Ct Unit 3
- 702 Monterey Ct
- 702 Monterey Ct
- 702 Monterey Ct
- 702 Ocean Front (Monterey Ct ) Walk
- 702 Monterey Ct
- 3535 Ocean Front Walk Unit L2
- 3533 Ocean Front Walk Unit L1
- 714 Monterey Ct
- 3539 Ocean Front Walk Unit U2
- 3537 Ocean Front Walk Unit L1
- 3517 Ocean Front Walk Unit B
- 3517 Ocean Front Walk Unit A
- 3519 Ocean Front Walk Unit C
- 3519 Ocean Front Walk Unit B
- 3519 Ocean Front Walk Unit A
- 3528 Mission Blvd Unit 32
- 3518 Mission Blvd
- 3545 Ocean Front Walk