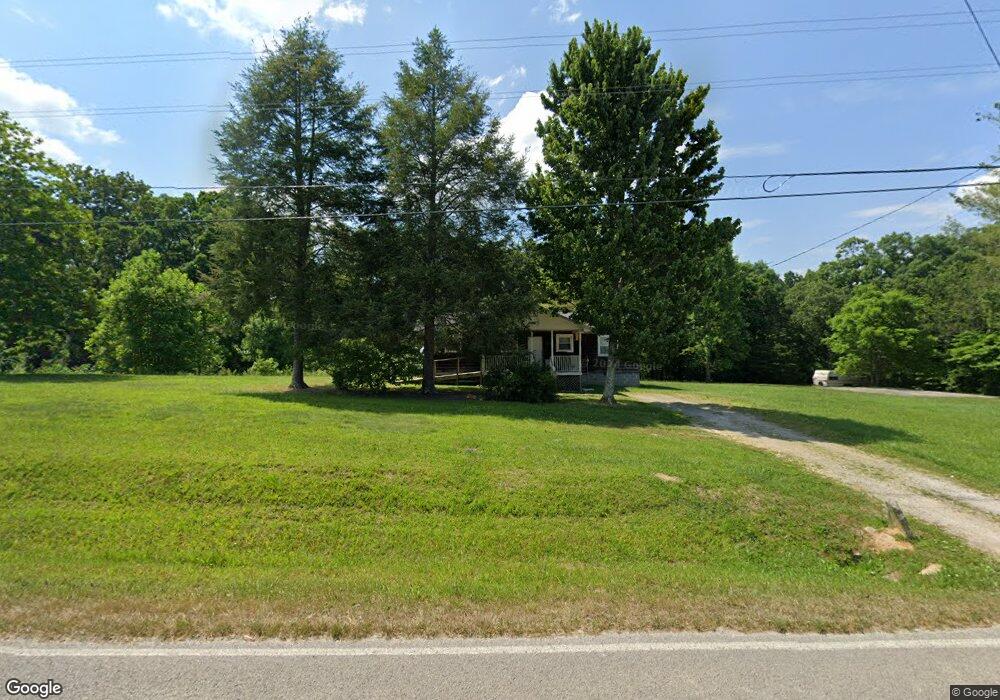
3531 Possum Trot Rd Grandview, TN 37337
Estimated Value: $154,237 - $231,000
2
Beds
1
Bath
1,010
Sq Ft
$200/Sq Ft
Est. Value
About This Home
This home is located at 3531 Possum Trot Rd, Grandview, TN 37337 and is currently estimated at $202,309, approximately $200 per square foot. 3531 Possum Trot Rd is a home located in Rhea County with nearby schools including Rhea County High School.
Ownership History
Date
Name
Owned For
Owner Type
Purchase Details
Closed on
Dec 3, 2021
Sold by
Triplett Jerry
Bought by
Triplett Atia S
Current Estimated Value
Purchase Details
Closed on
Jan 22, 2014
Sold by
Baggett Willard B
Bought by
Triplett Jerry
Home Financials for this Owner
Home Financials are based on the most recent Mortgage that was taken out on this home.
Original Mortgage
$24,300
Outstanding Balance
$18,429
Interest Rate
4.51%
Mortgage Type
New Conventional
Estimated Equity
$183,880
Purchase Details
Closed on
Dec 10, 2010
Sold by
Marler Sidney V
Bought by
Baggett Willard B
Purchase Details
Closed on
Nov 4, 2010
Sold by
Usa Rental Fund Llc
Bought by
Marler Sidney
Purchase Details
Closed on
Sep 30, 2010
Sold by
Federal National Mortgage Association
Bought by
Usa Rental Fund Llc
Purchase Details
Closed on
May 24, 2010
Sold by
Grant Douglas D
Bought by
Federal National Mtg Associati
Purchase Details
Closed on
Feb 25, 1984
Bought by
Grant Douglas D and Grant Janet
Create a Home Valuation Report for This Property
The Home Valuation Report is an in-depth analysis detailing your home's value as well as a comparison with similar homes in the area
Home Values in the Area
Average Home Value in this Area
Purchase History
| Date | Buyer | Sale Price | Title Company |
|---|---|---|---|
| Triplett Atia S | -- | None Available | |
| Triplett Jerry | $27,000 | -- | |
| Baggett Willard B | $25,000 | -- | |
| Marler Sidney | $16,000 | -- | |
| Usa Rental Fund Llc | $7,200 | -- | |
| Federal National Mtg Associati | $64,890 | -- | |
| Grant Douglas D | -- | -- |
Source: Public Records
Mortgage History
| Date | Status | Borrower | Loan Amount |
|---|---|---|---|
| Open | Triplett Jerry | $24,300 |
Source: Public Records
Tax History Compared to Growth
Tax History
| Year | Tax Paid | Tax Assessment Tax Assessment Total Assessment is a certain percentage of the fair market value that is determined by local assessors to be the total taxable value of land and additions on the property. | Land | Improvement |
|---|---|---|---|---|
| 2024 | $461 | $34,150 | $6,900 | $27,250 |
| 2023 | $258 | $11,425 | $3,875 | $7,550 |
| 2022 | $258 | $11,425 | $3,875 | $7,550 |
| 2021 | $258 | $11,425 | $3,875 | $7,550 |
| 2020 | $258 | $11,425 | $3,875 | $7,550 |
| 2019 | $254 | $11,425 | $3,875 | $7,550 |
| 2018 | $176 | $8,000 | $3,675 | $4,325 |
| 2017 | $176 | $8,000 | $3,675 | $4,325 |
| 2016 | $176 | $8,000 | $3,675 | $4,325 |
| 2015 | $168 | $8,000 | $3,675 | $4,325 |
| 2014 | -- | $11,550 | $3,675 | $7,875 |
| 2013 | -- | $14,575 | $3,675 | $10,900 |
Source: Public Records
Map
Nearby Homes
- 1347 Cawood Rd
- 517 Possum Trot Rd
- 28.6 acres Clifton Cemetery Rd
- 27435 Rhea County Hwy
- Lot 13/14 Clifton Cemetery Rd
- 5.9 acres Rhea County Hwy
- 0 Possum Trot Rd Unit 1290794
- 26954 Rhea County Hwy
- 2152 Alloway Rd
- 329 Flower Garden Rd
- 25992 Rhea County Hwy
- 12499 Tennessee 68
- 92+- Acres Dogwood Rd
- 25.24 AC Loyd Knox Rd
- 647 Omega Dr
- 277 Reids Ln
- 0 Vista Ridge Ct Unit 1264309
- 0 Vista Ridge Ct Unit RTC3015802
- Par 025 Grievers Chapel Rd
- 117 Mallard Duck Ln
- 3568 Possum Trot Rd
- 3568 Possum Trot Rd
- 0 Possum Trot Road Rd
- 112 Rear Tinkham Ln
- 3488 Possum Trot Rd
- 195 Jonas Holloway Ln
- 188 Big Neck Rd
- 144 Rear Tinkham Ln
- 3376 Possum Trot Rd
- Lot 3 Big Neck
- 2 Jonas Holloway Ln
- 1 Jonas Holloway Ln
- 0 Jonas Holloway Ln
- 0 Jonas Holloway Ln Unit RTC2951099
- 0 Jonas Holloway Ln Unit RTC2951098
- 0 Jonas Holloway Ln Unit 1229945
- 0 Jonas Holloway Ln Unit 205595
- 0 Jonas Holloway Ln Unit 205593
- 0 Jonas Holloway Ln Unit 1109913
- 294 Jonas Holloway Ln