
Last list price
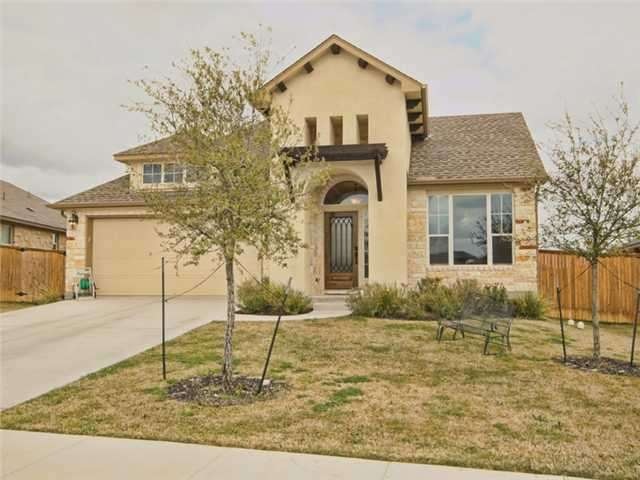
3532 Rosalina Loop Round Rock, TX 78665
Stony Point Neighborhood
3
Beds
2
Baths
2,004
Sq Ft
7,405
Sq Ft Lot
Highlights
- Covered patio or porch
- Attached Garage
- Walk-In Closet
- Herrington Elementary School Rated A
- Coffered Ceiling
- Tile Flooring
About This Home
As of February 2023Barely lived in, executive style single story, 3 bdrms PLUS office, PLUS formal dining room ready for immediate move in! Superiorly built with gorgeous ceramic tile floors in much of home. Amazing kitchen with granite counters opens up to spacious living area. Covered back porch, sprinkler system in front and back, professionally landscaped yard.
Last Agent to Sell the Property
Keller Williams Realty-RR WC License #0526083 Listed on: 04/01/2013
Home Details
Home Type
- Single Family
Est. Annual Taxes
- $7,982
Year Built
- Built in 2011
HOA Fees
- $40 Monthly HOA Fees
Home Design
- House
- Slab Foundation
- Composition Shingle Roof
Interior Spaces
- 2,004 Sq Ft Home
- Coffered Ceiling
- Window Treatments
- Fire and Smoke Detector
- Laundry on main level
Flooring
- Carpet
- Tile
Bedrooms and Bathrooms
- 3 Main Level Bedrooms
- Walk-In Closet
- 2 Full Bathrooms
Parking
- Attached Garage
- Front Facing Garage
Outdoor Features
- Covered patio or porch
Utilities
- Central Heating
- Heating System Uses Natural Gas
- Electricity To Lot Line
- Municipal Utilities District for Water and Sewer
- Phone Available
Community Details
- Association fees include common insurance
- Built by Standard Pacific
Listing and Financial Details
- Assessor Parcel Number 16487600OO0056
- 3% Total Tax Rate
Ownership History
Date
Name
Owned For
Owner Type
Purchase Details
Closed on
Nov 4, 2022
Sold by
Kennedy Cary Noel
Bought by
Kennedy Finn Joakim
Current Estimated Value
Purchase Details
Listed on
Jul 19, 2021
Closed on
Oct 29, 2021
Sold by
Zillow Homes Property Trust
Bought by
Kennedy Finn Joakim
Seller's Agent
Levi Rodgers
Levi Rodgers Real Estate Group
Buyer's Agent
Gabriel Recio
Redfin Corporation
List Price
$629,900
Sold Price
$455,500
Premium/Discount to List
-$174,400
-27.69%
Home Financials for this Owner
Home Financials are based on the most recent Mortgage that was taken out on this home.
Avg. Annual Appreciation
-1.99%
Original Mortgage
$364,400
Interest Rate
2.8%
Mortgage Type
New Conventional
Purchase Details
Closed on
Jul 2, 2021
Sold by
Warren W Cathy M Smith Rev Intervios Tr
Bought by
Zillow Homes Property Trust
Purchase Details
Closed on
Aug 7, 2014
Sold by
Smith Warren and Smith Cathy M
Bought by
Warren W Cathy M Smith Revocable Inter
Purchase Details
Listed on
Jun 29, 2013
Closed on
Jun 27, 2013
Sold by
Glenny Michael
Bought by
Smith Warren and Smith Cathy M
Seller's Agent
Andrew Constancio
Realty Texas LLC
Buyer's Agent
Melyssa Liberty
RAM Austin Property Management
Home Financials for this Owner
Home Financials are based on the most recent Mortgage that was taken out on this home.
Avg. Annual Appreciation
5.60%
Original Mortgage
$164,000
Interest Rate
3.63%
Mortgage Type
New Conventional
Purchase Details
Listed on
Dec 19, 2011
Closed on
Apr 16, 2012
Sold by
Standard Pacific Of Texas Inc
Bought by
Glenny Michael
Seller's Agent
John Mick
Pure Realty
Buyer's Agent
Suzie Gole
Keller Williams Realty-RR WC
List Price
$211,185
Sold Price
$197,685
Premium/Discount to List
-$13,500
-6.39%
Home Financials for this Owner
Home Financials are based on the most recent Mortgage that was taken out on this home.
Avg. Annual Appreciation
8.99%
Original Mortgage
$180,034
Interest Rate
3.92%
Mortgage Type
New Conventional
Similar Homes in Round Rock, TX
Create a Home Valuation Report for This Property
The Home Valuation Report is an in-depth analysis detailing your home's value as well as a comparison with similar homes in the area
Home Values in the Area
Average Home Value in this Area
Purchase History
| Date | Type | Sale Price | Title Company |
|---|---|---|---|
| Deed Of Distribution | -- | -- | |
| Vendors Lien | -- | Republic Title Of Texas | |
| Warranty Deed | -- | None Available | |
| Warranty Deed | -- | -- | |
| Vendors Lien | -- | Atc | |
| Vendors Lien | -- | None Available |
Source: Public Records
Mortgage History
| Date | Status | Loan Amount | Loan Type |
|---|---|---|---|
| Open | $328,000 | New Conventional | |
| Previous Owner | $364,400 | New Conventional | |
| Previous Owner | $164,000 | New Conventional | |
| Previous Owner | $180,034 | New Conventional |
Source: Public Records
Property History
| Date | Event | Price | Change | Sq Ft Price |
|---|---|---|---|---|
| 02/10/2023 02/10/23 | Sold | -- | -- | -- |
| 12/19/2022 12/19/22 | Pending | -- | -- | -- |
| 12/16/2022 12/16/22 | Price Changed | $429,000 | -2.3% | $214 / Sq Ft |
| 12/08/2022 12/08/22 | For Sale | $439,000 | 0.0% | $219 / Sq Ft |
| 11/30/2022 11/30/22 | Pending | -- | -- | -- |
| 11/25/2022 11/25/22 | Price Changed | $439,000 | -4.4% | $219 / Sq Ft |
| 11/04/2022 11/04/22 | Price Changed | $459,000 | -4.2% | $229 / Sq Ft |
| 10/14/2022 10/14/22 | For Sale | $479,000 | +6.5% | $239 / Sq Ft |
| 10/29/2021 10/29/21 | Sold | -- | -- | -- |
| 09/29/2021 09/29/21 | Pending | -- | -- | -- |
| 09/24/2021 09/24/21 | Price Changed | $449,900 | -2.2% | $225 / Sq Ft |
| 09/10/2021 09/10/21 | Price Changed | $459,900 | -2.1% | $229 / Sq Ft |
| 08/27/2021 08/27/21 | Price Changed | $469,900 | -6.0% | $234 / Sq Ft |
| 08/20/2021 08/20/21 | Price Changed | $499,900 | -6.5% | $249 / Sq Ft |
| 08/13/2021 08/13/21 | Price Changed | $534,900 | -7.8% | $267 / Sq Ft |
| 07/30/2021 07/30/21 | Price Changed | $579,900 | -7.9% | $289 / Sq Ft |
| 07/19/2021 07/19/21 | For Sale | $629,900 | 0.0% | $314 / Sq Ft |
| 06/19/2020 06/19/20 | Rented | $2,222 | +10.0% | -- |
| 06/16/2020 06/16/20 | Under Contract | -- | -- | -- |
| 06/04/2020 06/04/20 | For Rent | $2,020 | +3.9% | -- |
| 08/06/2018 08/06/18 | Rented | $1,945 | 0.0% | -- |
| 07/20/2018 07/20/18 | Under Contract | -- | -- | -- |
| 06/14/2018 06/14/18 | For Rent | $1,945 | 0.0% | -- |
| 05/31/2018 05/31/18 | Off Market | $1,945 | -- | -- |
| 05/30/2018 05/30/18 | Price Changed | $1,945 | +2.4% | $1 / Sq Ft |
| 05/30/2018 05/30/18 | For Rent | $1,900 | -1.3% | -- |
| 12/19/2016 12/19/16 | Rented | $1,925 | -3.5% | -- |
| 12/08/2016 12/08/16 | Under Contract | -- | -- | -- |
| 08/04/2016 08/04/16 | For Rent | $1,995 | +1.0% | -- |
| 05/06/2016 05/06/16 | Rented | $1,975 | 0.0% | -- |
| 04/04/2016 04/04/16 | Under Contract | -- | -- | -- |
| 03/23/2016 03/23/16 | For Rent | $1,975 | +2.6% | -- |
| 06/12/2015 06/12/15 | Rented | $1,925 | 0.0% | -- |
| 05/23/2015 05/23/15 | Under Contract | -- | -- | -- |
| 05/07/2015 05/07/15 | For Rent | $1,925 | +2.7% | -- |
| 07/18/2013 07/18/13 | Rented | $1,875 | 0.0% | -- |
| 07/15/2013 07/15/13 | Under Contract | -- | -- | -- |
| 06/29/2013 06/29/13 | For Rent | $1,875 | 0.0% | -- |
| 06/28/2013 06/28/13 | Sold | -- | -- | -- |
| 06/05/2013 06/05/13 | Pending | -- | -- | -- |
| 05/21/2013 05/21/13 | Price Changed | $220,000 | +0.5% | $110 / Sq Ft |
| 05/19/2013 05/19/13 | For Sale | $219,000 | 0.0% | $109 / Sq Ft |
| 04/07/2013 04/07/13 | Pending | -- | -- | -- |
| 04/07/2013 04/07/13 | Off Market | -- | -- | -- |
| 04/01/2013 04/01/13 | For Sale | $219,000 | +3.7% | $109 / Sq Ft |
| 04/20/2012 04/20/12 | Sold | -- | -- | -- |
| 03/20/2012 03/20/12 | Pending | -- | -- | -- |
| 12/19/2011 12/19/11 | For Sale | $211,185 | -- | $107 / Sq Ft |
Source: Unlock MLS (Austin Board of REALTORS®)
Tax History Compared to Growth
Tax History
| Year | Tax Paid | Tax Assessment Tax Assessment Total Assessment is a certain percentage of the fair market value that is determined by local assessors to be the total taxable value of land and additions on the property. | Land | Improvement |
|---|---|---|---|---|
| 2024 | $7,982 | $412,679 | $86,000 | $326,679 |
| 2023 | $8,652 | $429,629 | $86,000 | $343,629 |
| 2022 | $10,585 | $483,181 | $86,000 | $397,181 |
| 2021 | $8,828 | $332,431 | $66,000 | $266,431 |
| 2020 | $7,464 | $271,577 | $62,792 | $208,785 |
| 2019 | $7,767 | $273,635 | $54,998 | $218,637 |
| 2018 | $7,438 | $262,026 | $54,998 | $207,028 |
| 2017 | $7,889 | $264,645 | $51,400 | $213,245 |
| 2016 | $7,632 | $256,049 | $51,400 | $204,649 |
| 2015 | $6,428 | $230,792 | $42,300 | $188,492 |
| 2014 | $6,428 | $215,123 | $0 | $0 |
Source: Public Records
Agents Affiliated with this Home
-
G
Seller's Agent in 2023
Gabriel Recio
Redfin Corporation
-
A
Seller Co-Listing Agent in 2023
Ashley Backus
Team West Real Estate LLC
(512) 905-1612
2 in this area
37 Total Sales
-
Michael Wong
M
Buyer's Agent in 2023
Michael Wong
Texas Tripoint Realty, LLC
(714) 376-0594
2 in this area
10 Total Sales
-
L
Seller's Agent in 2021
Levi Rodgers
Levi Rodgers Real Estate Group
-
Mayra Torres
M
Seller Co-Listing Agent in 2021
Mayra Torres
Levi Rodgers Real Estate Group
(210) 331-7000
19 in this area
416 Total Sales
-
Loran Duncan
Seller's Agent in 2020
Loran Duncan
Navigate Real Estate
(512) 990-5074
4 in this area
38 Total Sales
Map
Source: Unlock MLS (Austin Board of REALTORS®)
MLS Number: 5873859
APN: R506117
Disclaimer: Certain information contained herein is derived from information provided by parties other than Homes.com. All information provided is deemed reliable, but is not guaranteed to be accurate and should be independently verified.
![]() Based on information from the Austin Board of REALTORS® (alternatively, from ACTRIS). Neither the Board nor ACTRIS guarantees or is in any way responsible for its accuracy. All data is provided “AS IS” and with all faults. Data maintained by the Board or ACTRIS may not reflect all real estate activity in the market.
Based on information from the Austin Board of REALTORS® (alternatively, from ACTRIS). Neither the Board nor ACTRIS guarantees or is in any way responsible for its accuracy. All data is provided “AS IS” and with all faults. Data maintained by the Board or ACTRIS may not reflect all real estate activity in the market.
Information being provided is for consumers’ personal, non-commercial use and may not be used for any purpose other than to identify prospective properties consumers may be interested in purchasing.
The Digital Millennium Copyright Act of 1998, 17 U.S.C. § 512 (the “DMCA”) provides recourse for copyright owners who believe that material appearing on the Internet infringes their rights under U.S. copyright law. If you believe in good faith that any content or material made available in connection with our website or services infringes your copyright, you (or your agent) may send us a notice requesting that the content or material be removed, or access to it blocked.
Notices must be sent in writing by email to DMCAnotice@MLSGrid.com.
The DMCA requires that your notice of alleged copyright infringement include the following information:
(1) description of the copyrighted work that is the subject of claimed infringement;
(2) description of the alleged infringing content and information sufficient to permit us to locate the content;
(3) contact information for you, including your address, telephone number and email address;
(4) a statement by you that you have a good faith belief that the content in the manner complained of is not authorized by the copyright owner, or its agent, or by the operation of any law;
(5) a statement by you, signed under penalty of perjury, that the information in the notification is accurate and that you have the authority to enforce the copyrights that are claimed to be infringed; and
(6) a physical or electronic signature of the copyright owner or a person authorized to act on the copyright owner’s behalf. Failure to include all of the above information may result in the delay of the processing of your complaint.
Nearby Homes
- 3541 Guadalajara St
- 3604 Rosalina Loop
- 3546 Guadalajara St
- 2935 Angelina Dr
- 3312 Cortes Place
- 3029 Columbus Loop
- 3443 Cortes Place
- 3320 Magellan Ct
- 7619 Europa Ave
- 1324 Chad Dr
- 6032 Urbano Bend
- 1531 N Red Bud Ln Unit 32
- 1531 N Red Bud Ln Unit 33
- 1531 N Red Bud Ln Unit 37
- 1531 N Red Bud Ln Unit 19
- 1531 N Red Bud Ln Unit 29
- 1531 N Red Bud Ln Unit 20
- 1531 N Red Bud Ln Unit 41
- 1531 N Red Bud Ln Unit 34
- 7920 Castelardo Place Unit 50