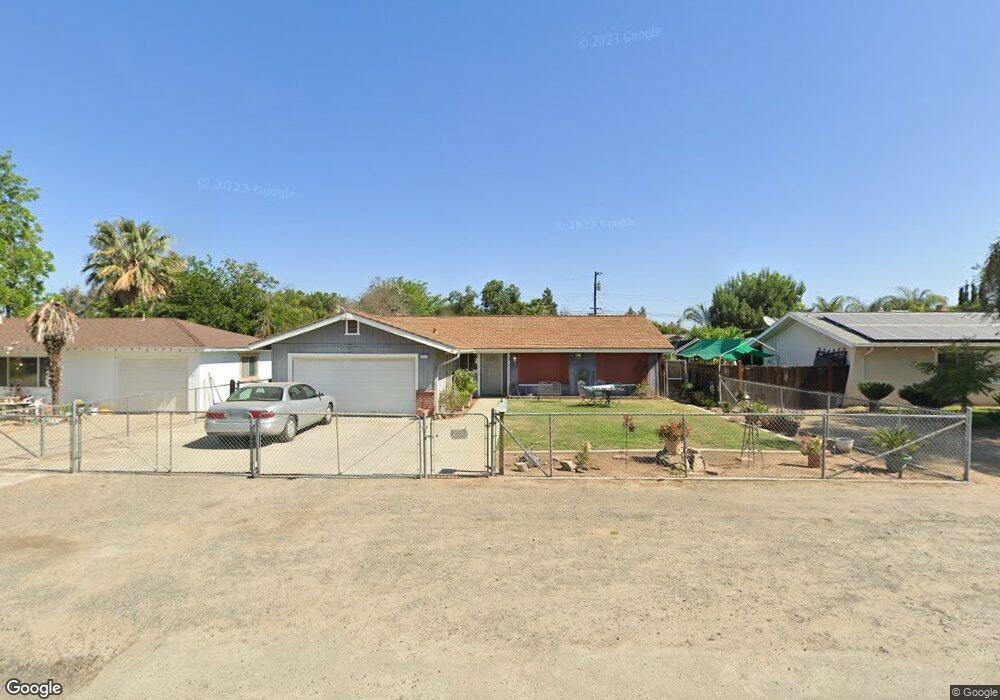
3532 W Peralta Way Fresno, CA 93722
West Fresno NeighborhoodEstimated Value: $344,215 - $370,000
3
Beds
2
Baths
1,510
Sq Ft
$239/Sq Ft
Est. Value
About This Home
This home is located at 3532 W Peralta Way, Fresno, CA 93722 and is currently estimated at $360,304, approximately $238 per square foot. 3532 W Peralta Way is a home located in Fresno County with nearby schools including Madison Elementary School, El Capitan Middle School, and Central East High School.
Ownership History
Date
Name
Owned For
Owner Type
Purchase Details
Closed on
Jul 7, 2000
Sold by
Federal National Mortgage Association
Bought by
Monroe Billie S and Monroe Linda M
Current Estimated Value
Home Financials for this Owner
Home Financials are based on the most recent Mortgage that was taken out on this home.
Original Mortgage
$86,866
Outstanding Balance
$30,995
Interest Rate
8.19%
Mortgage Type
FHA
Estimated Equity
$329,309
Purchase Details
Closed on
Nov 10, 1999
Sold by
Carlson Kristopher S and Carlson Laura E
Bought by
Federal National Mortgage Association
Purchase Details
Closed on
Sep 12, 1995
Sold by
Obrien Gerald D and Obrien Carol L
Bought by
Carlson Kristopher S and Carlson Laura E
Home Financials for this Owner
Home Financials are based on the most recent Mortgage that was taken out on this home.
Original Mortgage
$67,600
Interest Rate
7.62%
Create a Home Valuation Report for This Property
The Home Valuation Report is an in-depth analysis detailing your home's value as well as a comparison with similar homes in the area
Home Values in the Area
Average Home Value in this Area
Purchase History
| Date | Buyer | Sale Price | Title Company |
|---|---|---|---|
| Monroe Billie S | $87,000 | Fidelity National Title Co | |
| Federal National Mortgage Association | $70,534 | Fidelity National Title Ins | |
| Carlson Kristopher S | $84,500 | Landmark Title Company |
Source: Public Records
Mortgage History
| Date | Status | Borrower | Loan Amount |
|---|---|---|---|
| Open | Monroe Billie S | $86,866 | |
| Previous Owner | Carlson Kristopher S | $67,600 |
Source: Public Records
Tax History Compared to Growth
Tax History
| Year | Tax Paid | Tax Assessment Tax Assessment Total Assessment is a certain percentage of the fair market value that is determined by local assessors to be the total taxable value of land and additions on the property. | Land | Improvement |
|---|---|---|---|---|
| 2025 | $1,549 | $131,070 | $39,166 | $91,904 |
| 2023 | $1,510 | $125,983 | $37,647 | $88,336 |
| 2022 | $1,423 | $123,513 | $36,909 | $86,604 |
| 2021 | $1,433 | $121,092 | $36,186 | $84,906 |
| 2020 | $1,362 | $119,851 | $35,815 | $84,036 |
| 2019 | $1,340 | $117,502 | $35,113 | $82,389 |
| 2018 | $1,308 | $115,199 | $34,425 | $80,774 |
| 2017 | $1,311 | $112,941 | $33,750 | $79,191 |
| 2016 | $1,206 | $110,728 | $33,089 | $77,639 |
| 2015 | $1,201 | $109,065 | $32,592 | $76,473 |
| 2014 | $1,198 | $106,929 | $31,954 | $74,975 |
Source: Public Records
Map
Nearby Homes
- 1672 N Valentine Ave
- 3185 W Mckinley Ave
- 3154 W Mckinley Ave
- 3630 W Terrace Ave
- 1512 N Brawley Ave
- 3656 W Harvard Ave
- 3546 W Harvard Ave
- 2260 N Hanover Ave
- 1440 N Brawley Ave
- 4239 W Cambridge Ave
- 2413 N Sonora Ave
- 2209 N Marks Ave
- 2387 N Hanover Ave
- 4189 W Providence Ave
- 1345 N Brawley Ave
- 3304 W Elizabeth Ave
- 1714 N Blythe Ave
- 4360 W Vassar Ave
- 2691 N Brawley Ave
- 2533 W Mckinley Ave Unit 232
- 3538 W Peralta Way
- 3520 W Peralta Way
- 3539 W University Ave
- 3558 W Peralta Way
- 3521 W University Ave
- 3537 W Peralta Way
- 3563 W University Ave
- 2061 N Rafael Ave
- 3531 W Peralta Way
- 2089 N Rafael Ave
- 3561 W Peralta Way
- 2091 N Rafael Ave
- 3588 W Peralta Way
- 3509 W Peralta Way
- 3591 W University Ave
- 3536 W Mckinley Ave
- 3540 W University Ave
- 3528 W Mckinley Ave
- 3585 W Peralta Way
- 3522 W University Ave