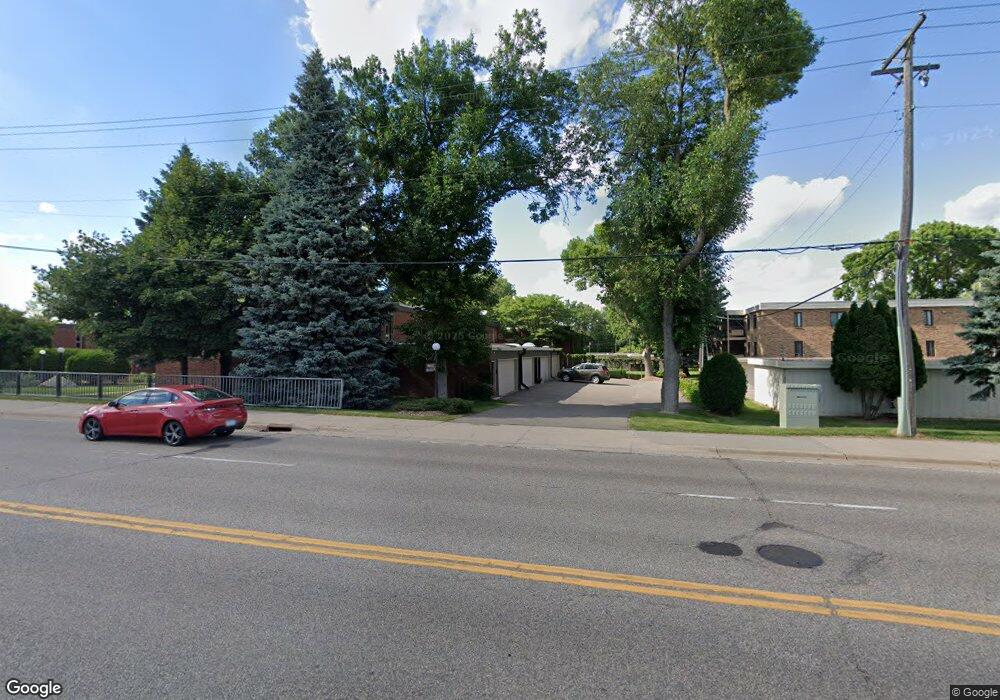
3533 37th Ave NE Columbia Heights, MN 55421
Estimated Value: $264,000 - $281,630
2
Beds
2
Baths
1,554
Sq Ft
$177/Sq Ft
Est. Value
About This Home
This home is located at 3533 37th Ave NE, Columbia Heights, MN 55421 and is currently estimated at $274,908, approximately $176 per square foot. 3533 37th Ave NE is a home located in Ramsey County with nearby schools including Wilshire Park Elementary School, Highland Elementary School, and St. Anthony Middle School.
Ownership History
Date
Name
Owned For
Owner Type
Purchase Details
Closed on
Dec 14, 2020
Sold by
Araya Haile F and Tesemma Afomiya G
Bought by
Kidane Robel G
Current Estimated Value
Home Financials for this Owner
Home Financials are based on the most recent Mortgage that was taken out on this home.
Original Mortgage
$217,280
Interest Rate
2.6%
Mortgage Type
New Conventional
Purchase Details
Closed on
Dec 20, 2016
Sold by
Huston Jeffrey M and Huston Sovady
Bought by
Araya Haile F and Tesemma Afomiya G
Home Financials for this Owner
Home Financials are based on the most recent Mortgage that was taken out on this home.
Original Mortgage
$160,000
Interest Rate
4.12%
Purchase Details
Closed on
Nov 2, 2006
Sold by
Wolkenstorfer Steffen L
Bought by
Huston Jeffrey M
Purchase Details
Closed on
Oct 30, 1997
Sold by
Nowlan Joan M
Bought by
Wolkerstorfer Steffen L
Create a Home Valuation Report for This Property
The Home Valuation Report is an in-depth analysis detailing your home's value as well as a comparison with similar homes in the area
Home Values in the Area
Average Home Value in this Area
Purchase History
| Date | Buyer | Sale Price | Title Company |
|---|---|---|---|
| Kidane Robel G | $224,000 | Land Title Inc | |
| Araya Haile F | $168,500 | Edina Realty Title Inc | |
| Huston Jeffrey M | $179,000 | -- | |
| Wolkerstorfer Steffen L | $89,900 | -- | |
| Kidane Robel Robel | $224,000 | -- |
Source: Public Records
Mortgage History
| Date | Status | Borrower | Loan Amount |
|---|---|---|---|
| Previous Owner | Kidane Robel G | $217,280 | |
| Previous Owner | Araya Haile F | $160,000 | |
| Closed | Kidane Robel Robel | $212,292 |
Source: Public Records
Tax History Compared to Growth
Tax History
| Year | Tax Paid | Tax Assessment Tax Assessment Total Assessment is a certain percentage of the fair market value that is determined by local assessors to be the total taxable value of land and additions on the property. | Land | Improvement |
|---|---|---|---|---|
| 2025 | $4,110 | $283,200 | $50,000 | $233,200 |
| 2023 | $4,110 | $246,800 | $50,000 | $196,800 |
| 2022 | $3,356 | $276,100 | $50,000 | $226,100 |
| 2021 | $3,254 | $206,100 | $50,000 | $156,100 |
| 2020 | $3,258 | $202,200 | $50,000 | $152,200 |
| 2019 | $2,784 | $192,600 | $23,700 | $168,900 |
| 2018 | $2,466 | $164,400 | $23,700 | $140,700 |
| 2017 | $2,736 | $146,500 | $23,700 | $122,800 |
| 2016 | $2,978 | $0 | $0 | $0 |
| 2015 | $1,960 | $150,300 | $23,700 | $126,600 |
| 2014 | $1,896 | $0 | $0 | $0 |
Source: Public Records
Map
Nearby Homes
- 3808 Foss Rd Unit 2
- 3511 Maplewood Dr
- 2446 County Road D W
- 3109 Wendhurst Ave
- 3912 Foss Rd Unit 206
- 4074 Foss Rd
- 4004 Foss Rd Unit 101
- 3004 36th Ave NE
- 544 Riviera Dr
- 4078 Foss Rd
- 519 Continental Dr
- 3532 Belden Dr NE
- 2911 Troseth Rd
- 3232 Old Highway 8
- 3212 33rd Ave NE
- 2916 Silver Lake Ct NE
- 950 Cessna Dr
- 2540 38th Ave NE Unit 217
- 2550 38th Ave NE Unit 112
- 2550 38th Ave NE Unit 208
- 3535 37th Ave NE
- 3531 37th Ave NE
- 3531 3531 37th-Avenue-ne
- 3531 3531 37th Ave NE
- 3537 37th Ave NE
- 0 37th Ave NE
- 3527 37th Ave NE
- 3525 37th Ave NE
- 3529 37th Ave NE
- 3525 3525 37th-Avenue-ne
- 3529 3529 37th-Avenue-ne
- 0 37th Ave NE
- 3523 37th Ave NE
- 3523 3523 37th-Avenue-ne
- 3521 37th Ave NE
- 3521 3521 37th Ave NE
- 3519 37th Ave NE
- 3517 3517 37th-Avenue-ne
- 3515 37th Ave NE
- 3705 Foss Rd