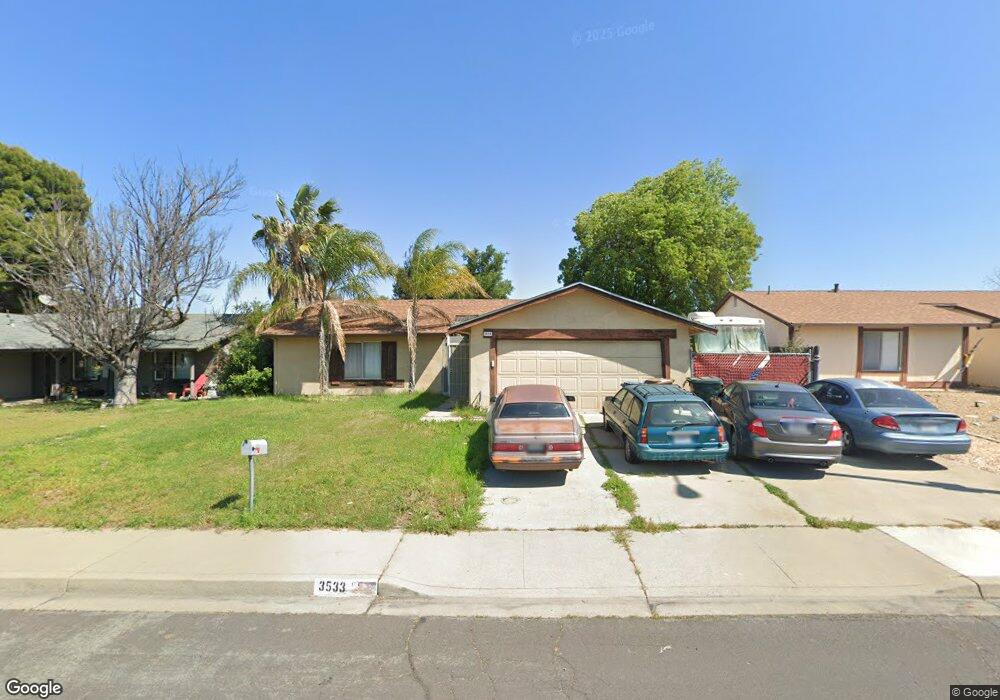
3533 Dimaggio Way Antioch, CA 94509
Contra Loma NeighborhoodEstimated Value: $502,063 - $600,000
3
Beds
2
Baths
1,348
Sq Ft
$400/Sq Ft
Est. Value
About This Home
This home is located at 3533 Dimaggio Way, Antioch, CA 94509 and is currently estimated at $539,516, approximately $400 per square foot. 3533 Dimaggio Way is a home located in Contra Costa County with nearby schools including Turner Elementary School, Antioch Middle School, and Antioch High School.
Ownership History
Date
Name
Owned For
Owner Type
Purchase Details
Closed on
Nov 2, 2012
Sold by
Krakowski Peter
Bought by
Yue Peng and Yun Limei
Current Estimated Value
Home Financials for this Owner
Home Financials are based on the most recent Mortgage that was taken out on this home.
Original Mortgage
$149,250
Outstanding Balance
$26,463
Interest Rate
3.36%
Mortgage Type
New Conventional
Estimated Equity
$513,053
Purchase Details
Closed on
Jun 13, 2012
Sold by
Kennedy Pauline
Bought by
Krakowski Peter
Purchase Details
Closed on
Jun 11, 2012
Sold by
Padilla Hector R and Padilla Carmen T
Bought by
Kennedy Pauline
Purchase Details
Closed on
Nov 15, 2002
Sold by
Southerland Wilfred J and Southerland Elaine J
Bought by
Padilla Hector R and Padilla Carmen T
Home Financials for this Owner
Home Financials are based on the most recent Mortgage that was taken out on this home.
Original Mortgage
$215,950
Interest Rate
5.89%
Mortgage Type
Purchase Money Mortgage
Create a Home Valuation Report for This Property
The Home Valuation Report is an in-depth analysis detailing your home's value as well as a comparison with similar homes in the area
Home Values in the Area
Average Home Value in this Area
Purchase History
| Date | Buyer | Sale Price | Title Company |
|---|---|---|---|
| Yue Peng | $207,000 | Old Republic Title Company | |
| Krakowski Peter | -- | Old Republic Title Company | |
| Krakowski Peter | $130,000 | None Available | |
| Kennedy Pauline | $130,000 | North American Title Company | |
| Padilla Hector R | $270,000 | North American Title |
Source: Public Records
Mortgage History
| Date | Status | Borrower | Loan Amount |
|---|---|---|---|
| Open | Yue Peng | $149,250 | |
| Previous Owner | Padilla Hector R | $215,950 |
Source: Public Records
Tax History Compared to Growth
Tax History
| Year | Tax Paid | Tax Assessment Tax Assessment Total Assessment is a certain percentage of the fair market value that is determined by local assessors to be the total taxable value of land and additions on the property. | Land | Improvement |
|---|---|---|---|---|
| 2025 | $3,332 | $254,893 | $55,409 | $199,484 |
| 2024 | $3,242 | $249,896 | $54,323 | $195,573 |
| 2023 | $3,242 | $244,997 | $53,258 | $191,739 |
| 2022 | $3,195 | $240,194 | $52,214 | $187,980 |
| 2021 | $3,070 | $235,486 | $51,191 | $184,295 |
| 2019 | $3,024 | $228,504 | $49,674 | $178,830 |
| 2018 | $2,918 | $224,024 | $48,700 | $175,324 |
| 2017 | $2,842 | $219,633 | $47,746 | $171,887 |
| 2016 | $2,772 | $215,327 | $46,810 | $168,517 |
| 2015 | $2,744 | $212,093 | $46,107 | $165,986 |
| 2014 | $2,662 | $207,939 | $45,204 | $162,735 |
Source: Public Records
Map
Nearby Homes
- 3163 S Francisco Way
- 2225 Sherman Ct
- 2208 Hamlin Dr
- 2217 Hamlin Dr
- 1618 Putnam St
- 2320 Meredith Way
- 3301 Saint James Place
- 2125 Robles Dr
- 3026 El Monte Ct
- 2205 Robles Dr
- 3019 El Monte Ct
- 2005 Cerro Ct
- 3326 Hacienda Way
- 4561 Union Ct
- 1205 Putnam St
- 3224 Madrone St
- 3366 S Francisco Way
- 2924 Ventura Ct
- 2921 Lucena Way
- 2928 El Monte Way
- 3601 Dimaggio Way
- 3529 Dimaggio Way
- 3605 Dimaggio Way
- 2100 Dillard Way
- 2101 Dillard Way
- 3609 Dimaggio Way
- 3521 Dimaggio Way
- 2104 Dillard Way
- 3524 Dimaggio Way
- 2105 Dillard Way
- 2100 Meredith Way
- 3613 Dimaggio Way
- 3517 Dimaggio Way
- 3520 Dimaggio Way
- 1612 S Francisco Ct
- 2108 Dillard Way
- 2109 Dillard Way
- 2104 Meredith Way
- 3141 Van Buren Place
- 3617 Dimaggio Way