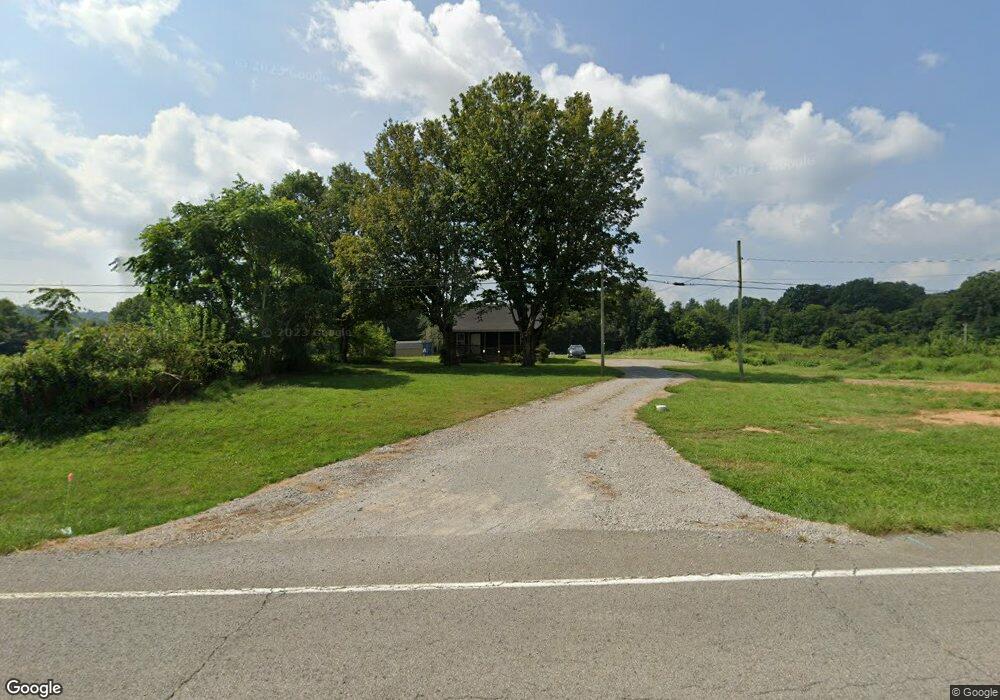
3533 Mooresville Hwy Culleoka, TN 38451
Estimated Value: $177,000 - $380,000
--
Bed
1
Bath
1,178
Sq Ft
$205/Sq Ft
Est. Value
About This Home
This home is located at 3533 Mooresville Hwy, Culleoka, TN 38451 and is currently estimated at $241,103, approximately $204 per square foot. 3533 Mooresville Hwy is a home located in Marshall County with nearby schools including Marshall Elementary School, Oak Grove Elementary School, and Westhills Elementary School.
Ownership History
Date
Name
Owned For
Owner Type
Purchase Details
Closed on
Oct 20, 2022
Sold by
Mcneese Properties Llc
Bought by
Webb Michael L and Webb Lacy Alexis
Current Estimated Value
Home Financials for this Owner
Home Financials are based on the most recent Mortgage that was taken out on this home.
Original Mortgage
$98,000
Outstanding Balance
$94,206
Interest Rate
5.89%
Mortgage Type
New Conventional
Estimated Equity
$146,897
Purchase Details
Closed on
Jul 19, 2021
Sold by
Rowe Michael B and Rowe Michael
Bought by
Mcneese Properies Llc
Home Financials for this Owner
Home Financials are based on the most recent Mortgage that was taken out on this home.
Original Mortgage
$93,807
Interest Rate
2.96%
Mortgage Type
Commercial
Purchase Details
Closed on
Jul 30, 2003
Sold by
Marvin Rowe and Marvin Sandra
Bought by
Michael Rowe
Purchase Details
Closed on
Aug 18, 2000
Bought by
Rowe Marvin Paul
Create a Home Valuation Report for This Property
The Home Valuation Report is an in-depth analysis detailing your home's value as well as a comparison with similar homes in the area
Home Values in the Area
Average Home Value in this Area
Purchase History
| Date | Buyer | Sale Price | Title Company |
|---|---|---|---|
| Webb Michael L | $98,000 | -- | |
| Webb Michael L | $98,000 | None Listed On Document | |
| Mcneese Properies Llc | $92,000 | Security T&E Co Llc | |
| Michael Rowe | $45,000 | -- | |
| Rowe Marvin Paul | $62,000 | -- |
Source: Public Records
Mortgage History
| Date | Status | Borrower | Loan Amount |
|---|---|---|---|
| Open | Webb Michael L | $98,000 | |
| Closed | Webb Michael L | $98,000 | |
| Previous Owner | Mcneese Properies Llc | $93,807 |
Source: Public Records
Tax History Compared to Growth
Tax History
| Year | Tax Paid | Tax Assessment Tax Assessment Total Assessment is a certain percentage of the fair market value that is determined by local assessors to be the total taxable value of land and additions on the property. | Land | Improvement |
|---|---|---|---|---|
| 2024 | $556 | $30,550 | $7,350 | $23,200 |
| 2023 | $556 | $30,550 | $7,350 | $23,200 |
| 2022 | $556 | $30,650 | $7,450 | $23,200 |
| 2021 | $898 | $31,950 | $4,675 | $27,275 |
| 2020 | $925 | $31,950 | $4,675 | $27,275 |
| 2019 | $898 | $31,950 | $4,675 | $27,275 |
| 2018 | $882 | $31,925 | $4,675 | $27,250 |
| 2017 | $882 | $31,925 | $4,675 | $27,250 |
| 2016 | $840 | $26,075 | $4,550 | $21,525 |
| 2015 | $840 | $26,075 | $4,550 | $21,525 |
| 2014 | $881 | $27,350 | $4,575 | $22,775 |
Source: Public Records
Map
Nearby Homes
- 3557 Mooresville Hwy
- 810 Fitzpatrick Rd
- 3242 Whitesell Rd
- 3295 Mooresville Hwy
- 3092 McKibbon Rd
- 1213 Globe Rd
- 2770 E Sheepneck Rd
- 1111 Craig Moore Rd
- 2673 Mcknight Rd
- 2668 Mcknight Rd
- 3264 Martin Hollow Rd
- 2661 Mooresville Hwy
- 2629 Winding Way Rd
- 2640 Winding Way Rd
- 0 Martin Hollow Rd
- 2523 Baptist Church Rd
- 0 Simmons Ridge Rd
- 2044 Jennifer Ln
- 2541 Mooresville Hwy
- 0 Webb Rd
- 3545 Mooresville Hwy
- 3568 Mooresville Hwy
- 3567 Mooresville Hwy
- 3558 Mooresville Hwy
- 3595 Mooresville Hwy
- 3604 Mooresville Hwy
- 3481 Mooresville Hwy
- 1133 Bear Creek Rd
- 2955 Demastus Rd
- 3617 Mooresville Hwy
- 2949 Demastus Rd
- 2969 Demastus Rd
- 1191 Bear Creek Rd
- 2989 Demastus Rd
- 845 Fitzpatrick Rd
- 2941 Demastus Rd
- 3115 Kirkland Rd
- 3437 Mooresville Hwy
- 2926 Demastus Rd
- 2931 Demastus Rd