Estimated Value: $152,000 - $193,000
5
Beds
2
Baths
1,613
Sq Ft
$103/Sq Ft
Est. Value
About This Home
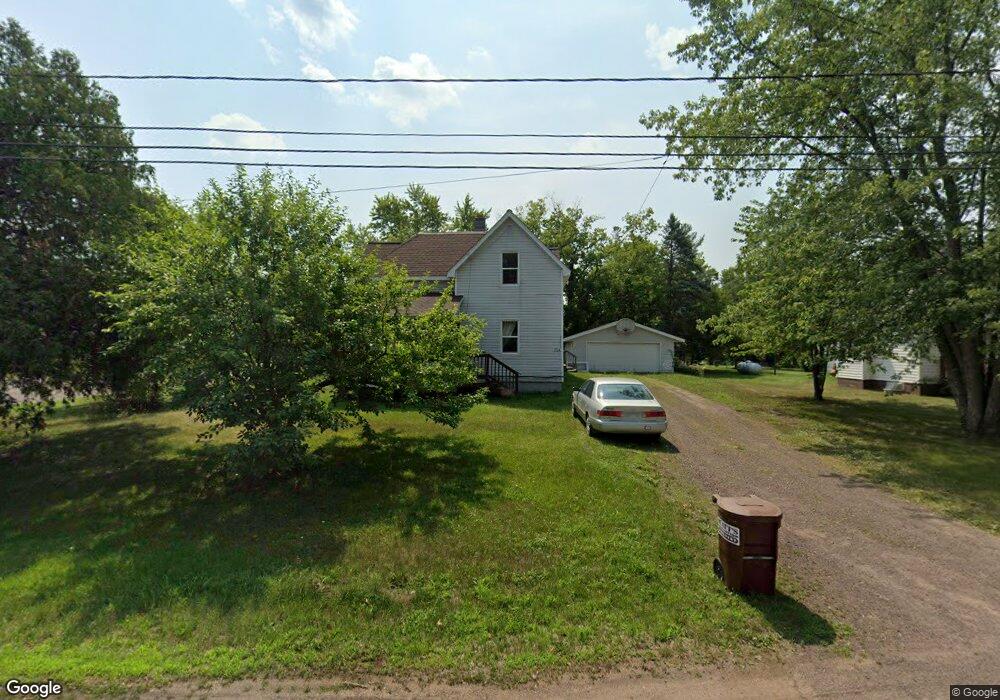
This home is located at 3534 Bregnedalgade, Askov, MN 55704 and is currently estimated at $166,929, approximately $103 per square foot. 3534 Bregnedalgade is a home located in Pine County with nearby schools including East Central Elementary School and East Central Senior Secondary School.
Ownership History
Date
Name
Owned For
Owner Type
Purchase Details
Closed on
Nov 10, 2016
Sold by
Bogenholm Elaine Elaine
Bought by
Donnelly Elyse Elyse
Current Estimated Value
Home Financials for this Owner
Home Financials are based on the most recent Mortgage that was taken out on this home.
Original Mortgage
$60,000
Outstanding Balance
$48,396
Interest Rate
3.57%
Estimated Equity
$118,533
Purchase Details
Closed on
Apr 16, 2012
Sold by
Johnson Charles Arthur and Johnson Jamie Marie
Bought by
Shepherd Tracy
Purchase Details
Closed on
May 2, 2011
Sold by
Bogenholm Scott and Bogenholm Elaine H
Bought by
Coons Jon A and Coons Danielle A
Home Financials for this Owner
Home Financials are based on the most recent Mortgage that was taken out on this home.
Original Mortgage
$63,000
Interest Rate
7%
Mortgage Type
Land Contract Argmt. Of Sale
Create a Home Valuation Report for This Property
The Home Valuation Report is an in-depth analysis detailing your home's value as well as a comparison with similar homes in the area
Purchase History
| Date | Buyer | Sale Price | Title Company |
|---|---|---|---|
| Donnelly Elyse Elyse | $60,000 | -- | |
| Donnelly Elyse K | -- | None Available | |
| Shepherd Tracy | -- | None Available | |
| Coons Jon A | $65,000 | -- |
Source: Public Records
Mortgage History
| Date | Status | Borrower | Loan Amount |
|---|---|---|---|
| Open | Donnelly Elyse Elyse | $60,000 | |
| Previous Owner | Coons Jon A | $63,000 |
Source: Public Records
Tax History
| Year | Tax Paid | Tax Assessment Tax Assessment Total Assessment is a certain percentage of the fair market value that is determined by local assessors to be the total taxable value of land and additions on the property. | Land | Improvement |
|---|---|---|---|---|
| 2025 | $1,792 | $158,400 | $23,200 | $135,200 |
| 2024 | $1,808 | $137,600 | $13,200 | $124,400 |
| 2023 | $1,496 | $130,600 | $24,200 | $106,400 |
| 2022 | $1,176 | $102,100 | $9,600 | $92,500 |
| 2021 | $1,044 | $78,600 | $9,600 | $69,000 |
| 2020 | $1,104 | $68,200 | $9,600 | $58,600 |
| 2019 | $1,052 | $76,400 | $9,600 | $66,800 |
| 2018 | $1,056 | $71,900 | $8,600 | $63,300 |
| 2017 | $1,038 | $73,100 | $7,600 | $65,500 |
| 2016 | $1,552 | $74,600 | $9,800 | $64,800 |
| 2014 | $820 | $38,800 | $5,277 | $33,523 |
Source: Public Records
Map
Nearby Homes
- 3510 Guvernorsvej
- 6348 H C Andersen Alle
- 3485 Mosevej
- 39985 Mulling Rd
- 40353 Root Rd
- XXX Tenquist Rd
- 58950 State Highway 23
- TBD Mallard Place
- 422 Court Ave N
- 418 Court Ave N
- 302 River Bluff Ave
- 24478 Wooded Cir
- 000 Minnesota 23
- 118 Division St
- 57082 Minnesota 23
- tbd Scotch Pine Rd
- 25690 Groningen Rd
- 6494 School St
- 1909 County Hwy 61
- 2022 Dixon Line Rd
- 3532 Bregnedalgade
- 6313 Kirke Alle
- 6332 Kirk Alle
- 6316 Kirke Alle
- 3535 Bregnedalgade
- 3533 Bregnedalgade
- 3531 Bregnedalgade
- 3545 Ferndale Ave
- 3527 Bregnedalgade
- 6324 Kirke Alle
- 6310 Kirke Alle
- 6310 Kirke Alle
- 6312 Kirke Alle
- 3523 Bregnedalgade
- 6306 Kirk Alle
- 3545 Bregnedalgade
- 3522 Bregnedalgade
- 3522 Ferndale
- 6330 Jernbanegade
- 3547 Guvernorsvej
Your Personal Tour Guide
Ask me questions while you tour the home.