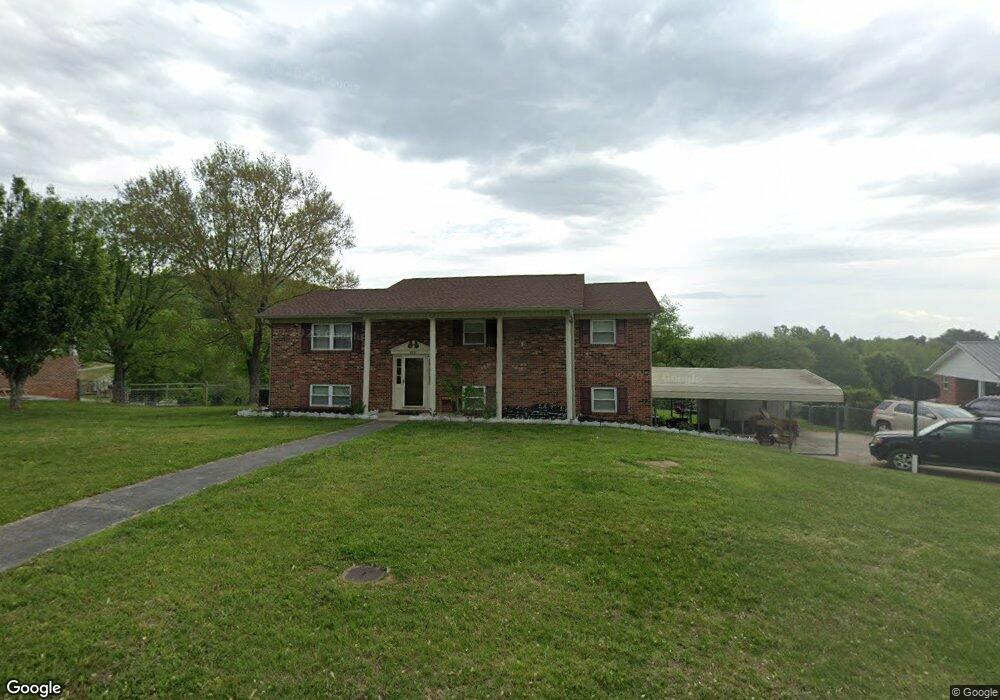
3535 Depew Cir Unit S/D Emerald Acres Morristown, TN 37814
Estimated Value: $287,000 - $343,000
3
Beds
3
Baths
1,323
Sq Ft
$233/Sq Ft
Est. Value
About This Home
This home is located at 3535 Depew Cir Unit S/D Emerald Acres, Morristown, TN 37814 and is currently estimated at $308,877, approximately $233 per square foot. 3535 Depew Cir Unit S/D Emerald Acres is a home located in Hamblen County with nearby schools including Manley Elementary School, West View Middle School, and Morristown West High School.
Ownership History
Date
Name
Owned For
Owner Type
Purchase Details
Closed on
May 5, 2016
Sold by
Oelze Mary Sue
Bought by
Johnson Shirley A and Dalton Mariena F
Current Estimated Value
Purchase Details
Closed on
Nov 24, 2009
Sold by
Reilly Thomas P
Bought by
Oelze Mary Sue
Purchase Details
Closed on
Mar 28, 2005
Sold by
Waldo Ben
Bought by
Reilly Thomas P
Home Financials for this Owner
Home Financials are based on the most recent Mortgage that was taken out on this home.
Original Mortgage
$92,000
Interest Rate
5.62%
Purchase Details
Closed on
May 28, 2002
Sold by
Thomas Bivens
Bought by
Clark Edwina
Home Financials for this Owner
Home Financials are based on the most recent Mortgage that was taken out on this home.
Original Mortgage
$98,800
Interest Rate
6.85%
Purchase Details
Closed on
Jan 23, 1985
Bought by
Overholt Wayne
Purchase Details
Closed on
Dec 14, 1983
Bought by
Moore Harry and Moore Pearl
Purchase Details
Closed on
Oct 21, 1976
Bought by
Moore Allen and Moore Burdetta
Create a Home Valuation Report for This Property
The Home Valuation Report is an in-depth analysis detailing your home's value as well as a comparison with similar homes in the area
Home Values in the Area
Average Home Value in this Area
Purchase History
| Date | Buyer | Sale Price | Title Company |
|---|---|---|---|
| Johnson Shirley A | $140,000 | -- | |
| Oelze Mary Sue | $139,000 | -- | |
| Reilly Thomas P | $115,000 | -- | |
| Clark Edwina | $96,900 | -- | |
| Overholt Wayne | $51,500 | -- | |
| Moore Harry | -- | -- | |
| Moore Allen | $34,000 | -- |
Source: Public Records
Mortgage History
| Date | Status | Borrower | Loan Amount |
|---|---|---|---|
| Previous Owner | Moore Allen | $92,000 | |
| Previous Owner | Moore Allen | $23,000 | |
| Previous Owner | Moore Allen | $98,800 |
Source: Public Records
Tax History Compared to Growth
Tax History
| Year | Tax Paid | Tax Assessment Tax Assessment Total Assessment is a certain percentage of the fair market value that is determined by local assessors to be the total taxable value of land and additions on the property. | Land | Improvement |
|---|---|---|---|---|
| 2024 | $666 | $33,800 | $4,300 | $29,500 |
| 2023 | $666 | $33,800 | $0 | $0 |
| 2022 | $666 | $33,800 | $4,300 | $29,500 |
| 2021 | $666 | $33,800 | $4,300 | $29,500 |
| 2020 | $666 | $33,800 | $4,300 | $29,500 |
| 2019 | $588 | $27,625 | $4,125 | $23,500 |
| 2018 | $588 | $27,625 | $4,125 | $23,500 |
| 2017 | $594 | $27,625 | $4,125 | $23,500 |
| 2016 | $555 | $27,900 | $4,125 | $23,775 |
| 2015 | $516 | $27,900 | $4,125 | $23,775 |
| 2014 | -- | $27,900 | $4,125 | $23,775 |
| 2013 | -- | $30,725 | $0 | $0 |
Source: Public Records
Map
Nearby Homes
- 3864 Apostle Rd
- 3415 Emerald Ave
- 3245 Emerald Ave
- 985 Kidwell Ridge Rd
- 837 Foxglove Ln
- 3641 Meadowland Dr
- 1019 Ashley Ct
- 3721 Meadowland Dr
- 1540 Kidwell Ridge Rd
- 1597 Kimberly Dr
- 623 Landen Cir
- 1466 Dandelion Cir
- 4193 Scarlett Dr
- 1701 Old Oak Ln
- 1855 Joe Stephens Rd
- 1406 Dandelion Cir
- 725 Barton Dr
- 1995 Bluebird Cir
- 1987 Joe Stephens Rd
- 1101 Drinnon Dr
- 3535 Depew Cir
- 3515 Depew Cir
- 3545 Depew Cir
- 3489 Depew Cir
- 3744 Apostle Rd
- 3565 Depew Cir
- 3530 Depew Cir
- 3516 Depew Cir
- 1143 Grand Dr
- 3774 Apostle Rd
- 3566 Depew Cir
- 3494 Depew Cir
- 1095 Grand Dr
- 3835 Emerald Ave
- 3755 Emerald Ave
- 3975 Emerald Ave
- 3486 Depew Cir
- 3525 Emerald Ave
- 3475 Emerald Ave
- 3725 Emerald Ave