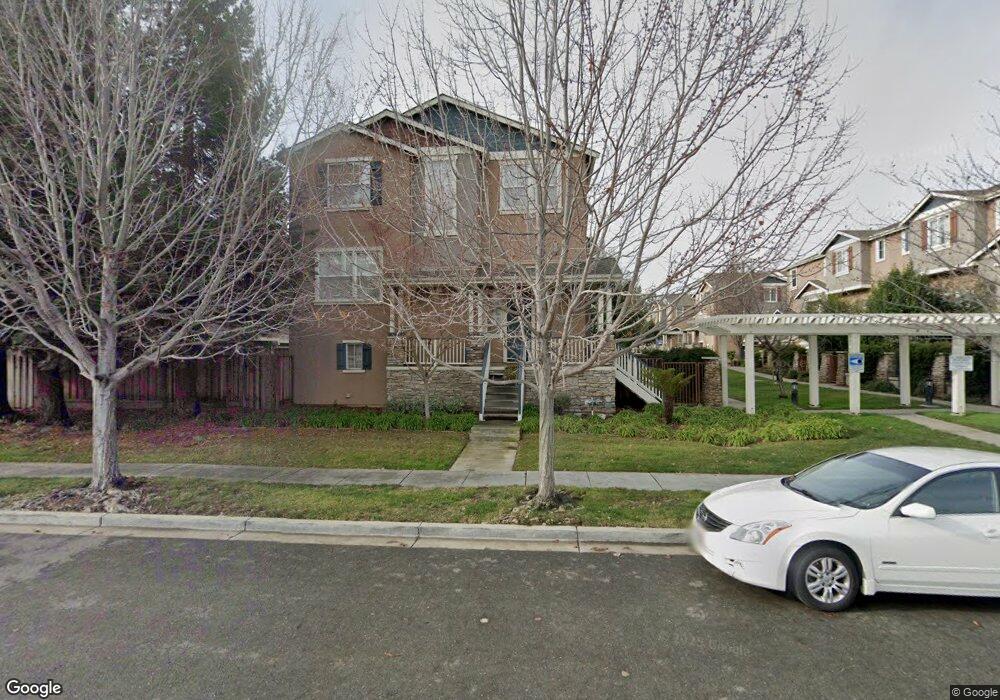
3535 Sequoia Common Fremont, CA 94536
Centerville District NeighborhoodEstimated Value: $1,002,000 - $1,241,000
3
Beds
3
Baths
1,864
Sq Ft
$626/Sq Ft
Est. Value
About This Home
This home is located at 3535 Sequoia Common, Fremont, CA 94536 and is currently estimated at $1,167,452, approximately $626 per square foot. 3535 Sequoia Common is a home located in Alameda County with nearby schools including Parkmont Elementary School, Centerville Junior High School, and Washington High School.
Ownership History
Date
Name
Owned For
Owner Type
Purchase Details
Closed on
Oct 27, 2020
Sold by
Mabaet Ferdinand Ma M
Bought by
Mabaet Ferdinand Ma M and The Mabaet Family Living Trust
Current Estimated Value
Home Financials for this Owner
Home Financials are based on the most recent Mortgage that was taken out on this home.
Original Mortgage
$375,000
Outstanding Balance
$271,441
Interest Rate
2.9%
Mortgage Type
New Conventional
Estimated Equity
$896,011
Purchase Details
Closed on
Jan 14, 2008
Sold by
Mabaet Ferdinand M
Bought by
The Mabaet Family Living Trust
Purchase Details
Closed on
Oct 18, 2005
Sold by
Everwood Developers
Bought by
Mabaet Ferdinand M
Home Financials for this Owner
Home Financials are based on the most recent Mortgage that was taken out on this home.
Original Mortgage
$570,450
Interest Rate
6.62%
Mortgage Type
Fannie Mae Freddie Mac
Create a Home Valuation Report for This Property
The Home Valuation Report is an in-depth analysis detailing your home's value as well as a comparison with similar homes in the area
Home Values in the Area
Average Home Value in this Area
Purchase History
| Date | Buyer | Sale Price | Title Company |
|---|---|---|---|
| Mabaet Ferdinand Ma M | -- | None Available | |
| Mabaet Ferdinand Ma M | -- | Wfg National Title Ins Co | |
| The Mabaet Family Living Trust | -- | None Available | |
| Mabaet Ferdinand M | $713,500 | First American Title Company |
Source: Public Records
Mortgage History
| Date | Status | Borrower | Loan Amount |
|---|---|---|---|
| Open | Mabaet Ferdinand Ma M | $375,000 | |
| Closed | Mabaet Ferdinand M | $570,450 |
Source: Public Records
Tax History
| Year | Tax Paid | Tax Assessment Tax Assessment Total Assessment is a certain percentage of the fair market value that is determined by local assessors to be the total taxable value of land and additions on the property. | Land | Improvement |
|---|---|---|---|---|
| 2025 | $11,474 | $967,285 | $292,422 | $681,863 |
| 2024 | $11,474 | $948,184 | $286,689 | $668,495 |
| 2023 | $11,172 | $936,460 | $281,069 | $655,391 |
| 2022 | $11,036 | $911,101 | $275,559 | $642,542 |
| 2021 | $10,768 | $893,104 | $270,157 | $629,947 |
| 2020 | $10,814 | $890,878 | $267,388 | $623,490 |
| 2019 | $10,698 | $873,417 | $262,147 | $611,270 |
| 2018 | $10,490 | $856,298 | $257,009 | $599,289 |
| 2017 | $10,227 | $839,514 | $251,972 | $587,542 |
| 2016 | $10,056 | $823,058 | $247,033 | $576,025 |
| 2015 | $9,094 | $740,000 | $222,000 | $518,000 |
| 2014 | $7,796 | $628,000 | $188,400 | $439,600 |
Source: Public Records
Map
Nearby Homes
- 3554 Shadowbrook Terrace
- 3584 Peralta Blvd
- 3291 Foxtail Terrace
- 37311 Aspenwood Common Unit 203
- 3550 Buttonwood Terrace Unit 111
- 3685 Nutwood Terrace Unit 313
- 37168 Meadowbrook Common Unit 304
- 37433 Fremont Blvd
- 37429 Fremont Blvd
- 37437 Fremont Blvd
- 37425 Fremont Blvd
- 3454 Bridgewood Terrace Unit 311
- 37445 Currant Terrace
- 37442 Hazel Terrace
- 37434 Hazel Terrace
- 3674 Oakwood Terrace Unit 302
- 3402 Pinewood Terrace Unit 211
- 3530 Oakwood Terrace Unit 102
- 3623 Sutton Loop
- 3395 Pinewood Terrace Unit 304
- 3529 Sequoia Common
- 3523 Sequoia Common
- 3517 Sequoia Common
- 3534 Sequoia Common
- 3540 Sequoia Common
- 3528 Sequoia Common
- 3536 Ridgemont Terrace
- 3546 Sequoia Common
- 3522 Sequoia Common
- 3530 Ridgemont Terrace
- 3524 Ridgemont Terrace
- 3516 Sequoia Common
- 37435 Glenbrook Terrace
- 3518 Ridgemont Terrace
- 37429 Glenbrook Terrace
- 888 Glenbrook Terrace
- 37421 Glenbrook Terrace
- 37432 Monteverde Terrace
- 3537 Ridgemont Terrace
- 37415 Glenbrook Terrace Unit A
Your Personal Tour Guide
Ask me questions while you tour the home.