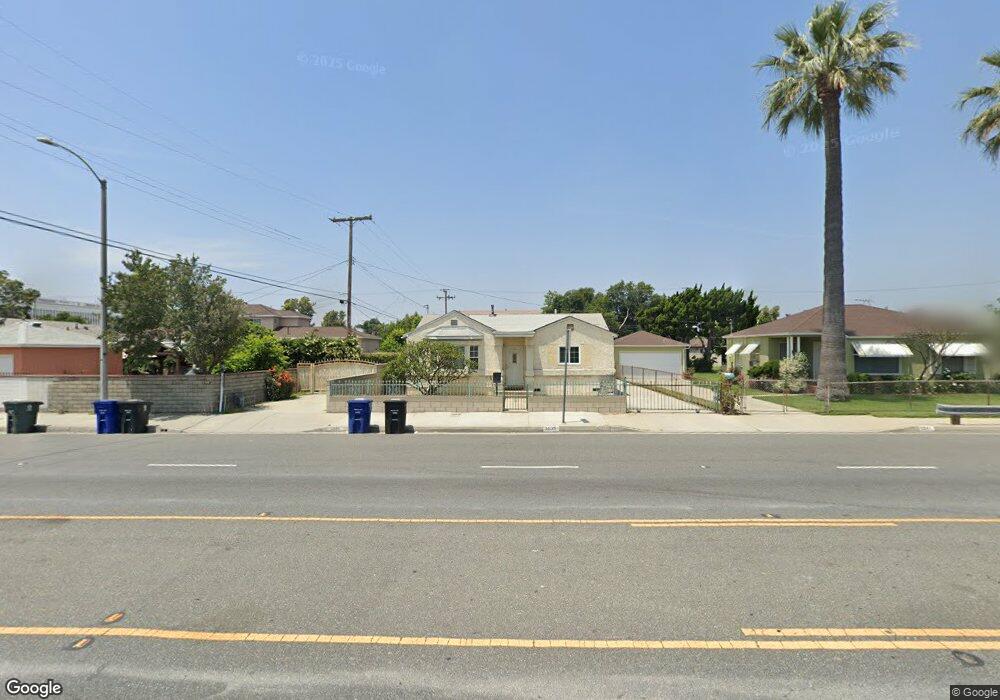
3535 Temple City Blvd Rosemead, CA 91770
Estimated Value: $889,000 - $1,009,000
3
Beds
2
Baths
1,470
Sq Ft
$652/Sq Ft
Est. Value
About This Home
This home is located at 3535 Temple City Blvd, Rosemead, CA 91770 and is currently estimated at $958,656, approximately $652 per square foot. 3535 Temple City Blvd is a home located in Los Angeles County with nearby schools including Savannah Elementary School, Muscatel Middle School, and Rosemead High School.
Ownership History
Date
Name
Owned For
Owner Type
Purchase Details
Closed on
May 29, 2002
Sold by
Lam Phu Sinh
Bought by
Lam Tat Thanh
Current Estimated Value
Purchase Details
Closed on
Oct 11, 2001
Sold by
Lam Phu S
Bought by
Lam Phu S and Lam Tat
Home Financials for this Owner
Home Financials are based on the most recent Mortgage that was taken out on this home.
Original Mortgage
$160,000
Interest Rate
6.9%
Purchase Details
Closed on
Sep 4, 2001
Sold by
Lai Kamen Kin Ip and Lam Michel Mei King
Bought by
Lam Phu S
Home Financials for this Owner
Home Financials are based on the most recent Mortgage that was taken out on this home.
Original Mortgage
$160,000
Interest Rate
6.9%
Purchase Details
Closed on
May 18, 1998
Sold by
Curry Pauline E Tr Curry Family Trust
Bought by
Lai Kaman Kin Ip and Lam Michel Mei King
Home Financials for this Owner
Home Financials are based on the most recent Mortgage that was taken out on this home.
Original Mortgage
$82,500
Interest Rate
7.06%
Create a Home Valuation Report for This Property
The Home Valuation Report is an in-depth analysis detailing your home's value as well as a comparison with similar homes in the area
Home Values in the Area
Average Home Value in this Area
Purchase History
| Date | Buyer | Sale Price | Title Company |
|---|---|---|---|
| Lam Tat Thanh | -- | -- | |
| Lam Phu S | -- | -- | |
| Lam Phu S | $227,000 | First Southwestern Title | |
| Lai Kaman Kin Ip | $177,500 | -- |
Source: Public Records
Mortgage History
| Date | Status | Borrower | Loan Amount |
|---|---|---|---|
| Closed | Lam Phu S | $160,000 | |
| Previous Owner | Lai Kaman Kin Ip | $82,500 |
Source: Public Records
Tax History Compared to Growth
Tax History
| Year | Tax Paid | Tax Assessment Tax Assessment Total Assessment is a certain percentage of the fair market value that is determined by local assessors to be the total taxable value of land and additions on the property. | Land | Improvement |
|---|---|---|---|---|
| 2025 | $4,662 | $355,264 | $223,058 | $132,206 |
| 2024 | $4,662 | $348,299 | $218,685 | $129,614 |
| 2023 | $4,679 | $341,471 | $214,398 | $127,073 |
| 2022 | $4,522 | $334,777 | $210,195 | $124,582 |
| 2021 | $4,469 | $328,214 | $206,074 | $122,140 |
| 2019 | $4,398 | $318,480 | $199,962 | $118,518 |
| 2018 | $4,146 | $312,237 | $196,042 | $116,195 |
| 2016 | $3,941 | $300,115 | $188,431 | $111,684 |
| 2015 | $3,946 | $295,608 | $185,601 | $110,007 |
| 2014 | $3,863 | $289,819 | $181,966 | $107,853 |
Source: Public Records
Map
Nearby Homes
- 3516 Marybeth Ave
- 3742 Temple City Blvd
- 3565 Lashbrook Ave
- 9925 Woodrich Ln
- 3708 Baldwin Ave Unit 6
- 10115 Olney St
- 9336 Ralph St
- 3161 Adelia Ave
- 4013 Rowland Ave
- 9620 Lorica St
- 3606 Beuville Ave
- 9729 Cortada St
- 9614 Lorica St
- 9724 Cortada St Unit A
- 9043 De Adalena St
- 4110 Loma Ave
- 4320 Rio Hondo Ave
- 4332 Rio Hondo Ave
- 3951 Arden Dr
- 9043 Steele St
- 3541 Temple City Blvd
- 3531 Temple City Blvd
- 9633 Olney St
- 9639 Olney St
- 3545 Temple City Blvd
- 9623 Olney St
- 6528 Olney St
- 3516 Ellis Ln
- 3553 Temple City Blvd
- 9619 Olney St
- 9703 Olney St
- 3534 Temple City Blvd
- 3540 Temple City Blvd
- 9706 Loftus Dr
- 3603 Temple City Blvd
- 9613 Olney St
- 3522 Ellis Ln
- 9709 Olney St
- 9638 Olney St
- 9609 Olney St