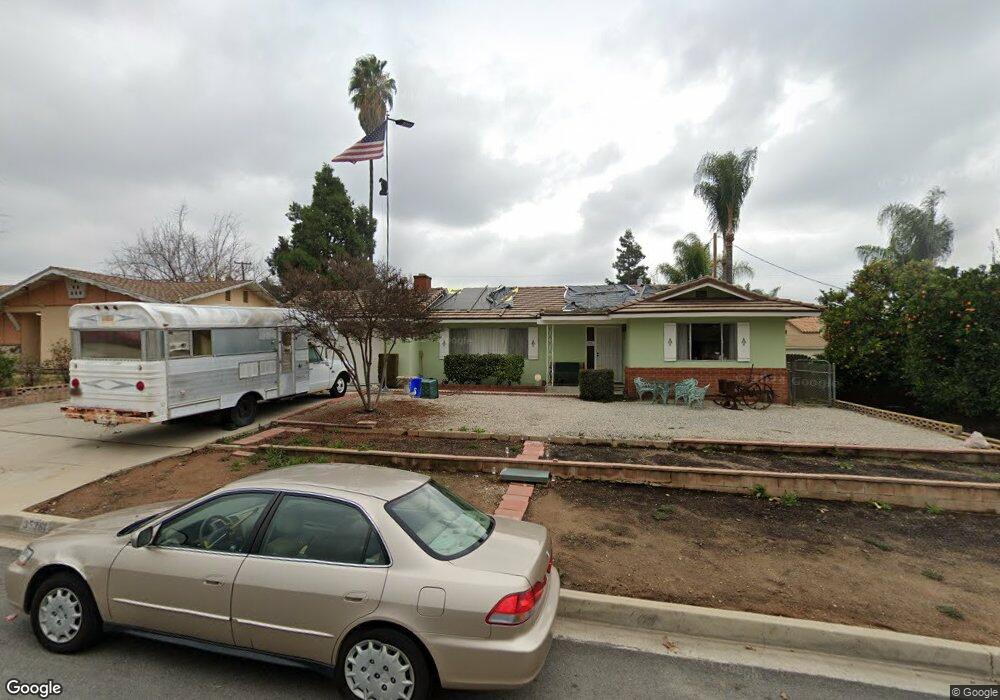
35361 Sunlight Dr Yucaipa, CA 92399
Estimated Value: $481,000 - $517,000
2
Beds
2
Baths
1,484
Sq Ft
$337/Sq Ft
Est. Value
About This Home
This home is located at 35361 Sunlight Dr, Yucaipa, CA 92399 and is currently estimated at $500,367, approximately $337 per square foot. 35361 Sunlight Dr is a home located in San Bernardino County with nearby schools including Wildwood Elementary School, Mesa View Middle School, and Yucaipa High School.
Ownership History
Date
Name
Owned For
Owner Type
Purchase Details
Closed on
Apr 9, 1998
Sold by
Lagerman Carol E
Bought by
Mendel Jerry Arthur
Current Estimated Value
Home Financials for this Owner
Home Financials are based on the most recent Mortgage that was taken out on this home.
Original Mortgage
$94,000
Outstanding Balance
$17,782
Interest Rate
7.06%
Mortgage Type
Seller Take Back
Estimated Equity
$482,585
Purchase Details
Closed on
May 31, 1996
Sold by
Arrowood Johnnie L
Bought by
Lagerman Carol E
Home Financials for this Owner
Home Financials are based on the most recent Mortgage that was taken out on this home.
Original Mortgage
$20,000
Interest Rate
8.03%
Purchase Details
Closed on
Jan 31, 1995
Sold by
Larsen Mary L
Bought by
Arrowood Johnnie L
Purchase Details
Closed on
Aug 5, 1993
Sold by
Larsen Mary L
Bought by
Larsen Mary L and Arrowood Johnnie L
Create a Home Valuation Report for This Property
The Home Valuation Report is an in-depth analysis detailing your home's value as well as a comparison with similar homes in the area
Home Values in the Area
Average Home Value in this Area
Purchase History
| Date | Buyer | Sale Price | Title Company |
|---|---|---|---|
| Mendel Jerry Arthur | $96,000 | Commonwealth Land Title Co | |
| Lagerman Carol E | $90,000 | Commonwealth Land Title Co | |
| Arrowood Johnnie L | -- | -- | |
| Larsen Mary L | -- | -- |
Source: Public Records
Mortgage History
| Date | Status | Borrower | Loan Amount |
|---|---|---|---|
| Open | Mendel Jerry Arthur | $94,000 | |
| Previous Owner | Lagerman Carol E | $20,000 |
Source: Public Records
Tax History
| Year | Tax Paid | Tax Assessment Tax Assessment Total Assessment is a certain percentage of the fair market value that is determined by local assessors to be the total taxable value of land and additions on the property. | Land | Improvement |
|---|---|---|---|---|
| 2025 | $2,320 | $150,501 | $47,031 | $103,470 |
| 2024 | $2,257 | $147,550 | $46,109 | $101,441 |
| 2023 | $2,158 | $144,657 | $45,205 | $99,452 |
| 2022 | $2,014 | $141,821 | $44,319 | $97,502 |
| 2021 | $1,976 | $139,040 | $43,450 | $95,590 |
| 2020 | $1,981 | $137,614 | $43,004 | $94,610 |
| 2019 | $1,907 | $134,916 | $42,161 | $92,755 |
| 2018 | $1,636 | $132,270 | $41,334 | $90,936 |
| 2017 | $1,601 | $129,677 | $40,524 | $89,153 |
| 2016 | $1,580 | $127,134 | $39,729 | $87,405 |
| 2015 | $1,564 | $125,224 | $39,132 | $86,092 |
| 2014 | $1,533 | $122,771 | $38,365 | $84,406 |
Source: Public Records
Map
Nearby Homes
- 12995 Leith Way
- 35211 Elm Ln
- 35550 Bella Vista Dr
- 12770 Douglas St
- 12779 Douglas St
- 35194 Velardo Dr
- 35597 Velardo Dr
- 35131 Wildwood Canyon Rd
- 13288 Bryant St
- 35695 Wildwood Canyon Rd
- 35716 Wildwood Canyon Rd
- 12704 California St
- 35498 Avenue H
- 12941 2nd St Space#63 Unit 63
- 12650 California St Unit 72
- 12650 California St Unit 15
- 35155 Avenue E
- 35372 Avenue E
- 12566 Fremont St
- 0 Brookwood Ct
- 35371 Sunlight Dr
- 35347 Sunlight Dr
- 13005 Monterey Dr
- 35354 Cabrini Dr
- 35381 Sunlight Dr
- 13017 Monterey Dr
- 35368 Cabrini Dr
- 35364 Sunlight Dr
- 35380 Cabrini Dr
- 35354 Sunlight Dr
- 35374 Sunlight Dr
- 35342 Cabrini Dr
- 35344 Sunlight Dr
- 35384 Sunlight Dr
- 35392 Cabrini Dr
- 35334 Sunlight Dr
- 35394 Sunlight Dr
- 13002 Monterey Dr
- 35317 Sunlight Dr
- 35407 Sunlight Dr
Your Personal Tour Guide
Ask me questions while you tour the home.