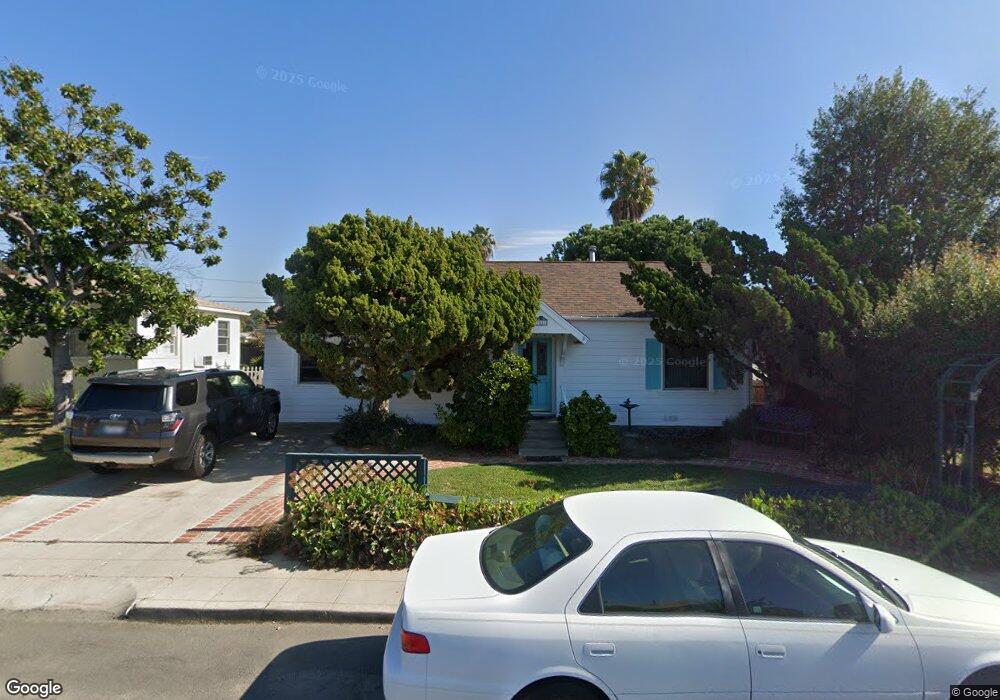
3537 Boundary St San Diego, CA 92104
North Park NeighborhoodEstimated Value: $1,058,000 - $1,216,000
3
Beds
2
Baths
1,272
Sq Ft
$892/Sq Ft
Est. Value
About This Home
This home is located at 3537 Boundary St, San Diego, CA 92104 and is currently estimated at $1,134,807, approximately $892 per square foot. 3537 Boundary St is a home located in San Diego County with nearby schools including McKinley Elementary School, Roosevelt International Middle School, and St. Patrick's School.
Ownership History
Date
Name
Owned For
Owner Type
Purchase Details
Closed on
Jul 24, 2015
Sold by
Terrell David L and Terrell Dana L
Bought by
Terrell David L and Trustees Dana L
Current Estimated Value
Purchase Details
Closed on
Nov 1, 1996
Sold by
Wasson Kenneth J and Wasson Kerry A
Bought by
Terrell David L and Terrell Dana L
Home Financials for this Owner
Home Financials are based on the most recent Mortgage that was taken out on this home.
Original Mortgage
$127,500
Interest Rate
7.58%
Mortgage Type
VA
Purchase Details
Closed on
Oct 30, 1996
Sold by
Young Gary W
Bought by
Young Kerry A
Home Financials for this Owner
Home Financials are based on the most recent Mortgage that was taken out on this home.
Original Mortgage
$127,500
Interest Rate
7.58%
Mortgage Type
VA
Purchase Details
Closed on
Nov 30, 1989
Purchase Details
Closed on
Jul 11, 1989
Create a Home Valuation Report for This Property
The Home Valuation Report is an in-depth analysis detailing your home's value as well as a comparison with similar homes in the area
Home Values in the Area
Average Home Value in this Area
Purchase History
| Date | Buyer | Sale Price | Title Company |
|---|---|---|---|
| Terrell David L | -- | None Available | |
| Terrell David L | $125,000 | Fidelity National Title | |
| Young Kerry A | -- | Fidelity National Title | |
| Wasson Kenneth J | -- | Fidelity National Title | |
| -- | $185,000 | -- | |
| -- | $135,000 | -- |
Source: Public Records
Mortgage History
| Date | Status | Borrower | Loan Amount |
|---|---|---|---|
| Previous Owner | Terrell David L | $127,500 |
Source: Public Records
Tax History Compared to Growth
Tax History
| Year | Tax Paid | Tax Assessment Tax Assessment Total Assessment is a certain percentage of the fair market value that is determined by local assessors to be the total taxable value of land and additions on the property. | Land | Improvement |
|---|---|---|---|---|
| 2025 | $2,432 | $203,553 | $122,133 | $81,420 |
| 2024 | $2,432 | $199,563 | $119,739 | $79,824 |
| 2023 | $2,375 | $195,651 | $117,392 | $78,259 |
| 2022 | $2,309 | $191,816 | $115,091 | $76,725 |
| 2021 | $2,290 | $188,056 | $112,835 | $75,221 |
| 2020 | $2,262 | $186,129 | $111,679 | $74,450 |
| 2019 | $2,220 | $182,481 | $109,490 | $72,991 |
| 2018 | $2,076 | $178,904 | $107,344 | $71,560 |
| 2017 | $80 | $175,397 | $105,240 | $70,157 |
| 2016 | $1,990 | $171,959 | $103,177 | $68,782 |
| 2015 | $1,960 | $169,377 | $101,628 | $67,749 |
| 2014 | $1,929 | $166,060 | $99,638 | $66,422 |
Source: Public Records
Map
Nearby Homes
- 3344 Upas St
- 3544 Boundary St
- 3322 Nile St
- 3257 Dwight St
- 3509-11 32nd St
- 3421 Vancouver Ave
- 0 Boundary St Unit SB25155904
- 3352 Redwood St
- 3455 Landis St
- 3274 Redwood St
- 3524-26 36th St
- 3705 Swift Ave
- 3124-26 32nd St
- 3653 Wilson Ave
- 3365 Grim Ave
- 3365-69 Grim Ave
- 3780 32nd St
- 3577-85 Landis St
- 0 35th St
- 3694 36th St
- 3531 Boundary St
- 3545 Boundary St
- 3523 Boundary St
- 3551 Boundary St
- 3518 Boundary St
- 3524 Boundary St
- 3517 Boundary St Unit 19
- 3382 Myrtle Ave
- 3559 Boundary St
- 3374 Myrtle Ave
- 3509 Boundary St Unit 11
- 3538 Nile St
- 3542 Nile St
- 3530 Nile St
- 3546 Nile St
- 3565 Boundary St
- 3526 Nile St
- 3366 Myrtle Ave
- 3550 Nile St Unit 56
- 3520 Nile St