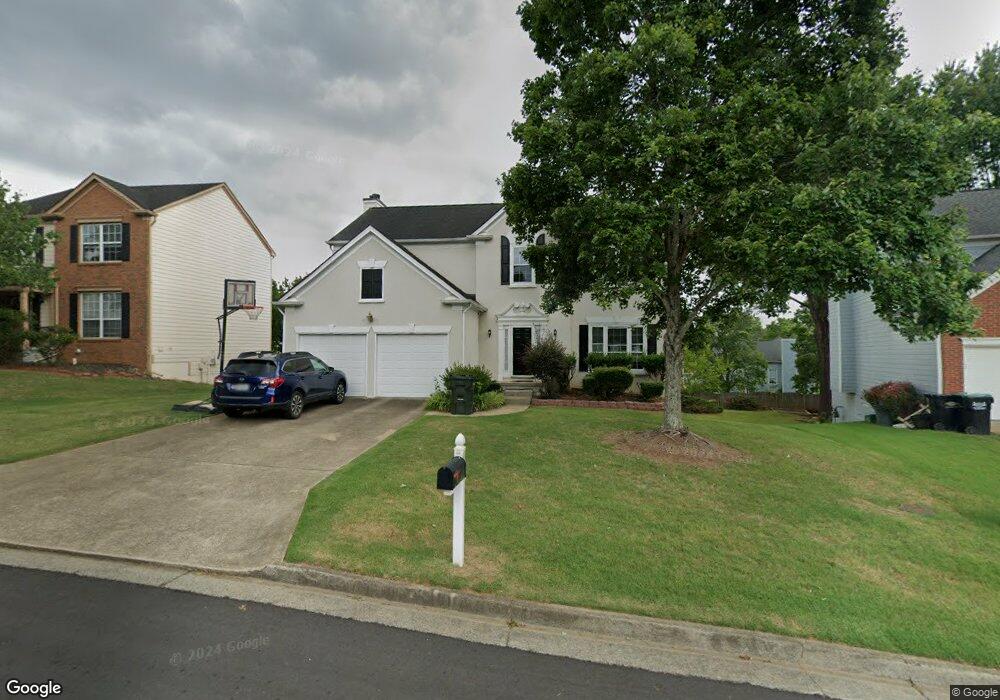
3537 Chasefield Way NE Unit 1 Marietta, GA 30066
Sandy Plains NeighborhoodEstimated Value: $451,000 - $506,000
4
Beds
3
Baths
2,328
Sq Ft
$206/Sq Ft
Est. Value
About This Home
This home is located at 3537 Chasefield Way NE Unit 1, Marietta, GA 30066 and is currently estimated at $479,357, approximately $205 per square foot. 3537 Chasefield Way NE Unit 1 is a home located in Cobb County with nearby schools including Blackwell Elementary School, Daniell Middle School, and Sprayberry High School.
Ownership History
Date
Name
Owned For
Owner Type
Purchase Details
Closed on
Aug 21, 2002
Sold by
Wen Kai
Bought by
Wen Kai
Current Estimated Value
Home Financials for this Owner
Home Financials are based on the most recent Mortgage that was taken out on this home.
Original Mortgage
$145,000
Interest Rate
6.49%
Mortgage Type
New Conventional
Purchase Details
Closed on
Nov 3, 2000
Sold by
Lin Mark W
Bought by
Wen Kai
Home Financials for this Owner
Home Financials are based on the most recent Mortgage that was taken out on this home.
Original Mortgage
$148,000
Interest Rate
7.93%
Mortgage Type
New Conventional
Purchase Details
Closed on
Jun 30, 1997
Sold by
Pulte Home Corp
Bought by
Lin Mark W
Home Financials for this Owner
Home Financials are based on the most recent Mortgage that was taken out on this home.
Original Mortgage
$96,000
Interest Rate
7.92%
Mortgage Type
New Conventional
Create a Home Valuation Report for This Property
The Home Valuation Report is an in-depth analysis detailing your home's value as well as a comparison with similar homes in the area
Home Values in the Area
Average Home Value in this Area
Purchase History
| Date | Buyer | Sale Price | Title Company |
|---|---|---|---|
| Wen Kai | -- | -- | |
| Wen Kai | $185,000 | -- | |
| Lin Mark W | $160,100 | -- |
Source: Public Records
Mortgage History
| Date | Status | Borrower | Loan Amount |
|---|---|---|---|
| Closed | Wen Kai | $145,000 | |
| Previous Owner | Wen Kai | $148,000 | |
| Previous Owner | Lin Mark W | $96,000 |
Source: Public Records
Tax History Compared to Growth
Tax History
| Year | Tax Paid | Tax Assessment Tax Assessment Total Assessment is a certain percentage of the fair market value that is determined by local assessors to be the total taxable value of land and additions on the property. | Land | Improvement |
|---|---|---|---|---|
| 2024 | $4,413 | $185,736 | $40,000 | $145,736 |
| 2023 | $3,449 | $166,308 | $40,000 | $126,308 |
| 2022 | $3,040 | $121,416 | $26,000 | $95,416 |
| 2021 | $3,040 | $121,416 | $26,000 | $95,416 |
| 2020 | $2,641 | $103,164 | $22,000 | $81,164 |
| 2019 | $2,641 | $103,164 | $22,000 | $81,164 |
| 2018 | $2,459 | $94,844 | $22,000 | $72,844 |
| 2017 | $2,353 | $94,844 | $22,000 | $72,844 |
| 2016 | $2,090 | $82,808 | $24,000 | $58,808 |
| 2015 | $2,142 | $82,808 | $24,000 | $58,808 |
| 2014 | $2,044 | $77,672 | $0 | $0 |
Source: Public Records
Map
Nearby Homes
- 3418 Chastain Glen Ln NE
- 671 Glenbarrett Ct NE Unit IV
- 661 Glenbarrett Ct NE
- 799 Weybourne Ct
- 795 Weybourne Ct
- 3301 Chastain Ridge Dr
- 605 Embry Ln
- 589 Whisperwill Dr
- 3674 Canton Rd
- 3776 Westchase Dr
- 3819 Courson St
- 692 Suholden Cir
- 3924 Devonshire Dr
- 3265 Hilltop Cir
- 3275 Hilltop Cir
- 3216 Guynelle Dr
- 3978 Devonshire Dr
- 1031 Lakewood Dr
- 3535 Chasefield Way NE Unit 115D
- 3535 Chasefield Way NE
- 3539 Chasefield Way NE Unit 1
- 3560 Courtfield Trace NE
- 3558 Courtfield Trace NE
- 3533 Chasefield Way NE
- 3541 Chasefield Way NE
- 3562 Courtfield Trace NE
- 0 Chasefield Way Unit 8740458
- 0 Chasefield Way Unit 3172781
- 630 Chasefield Ct NE
- 630 Chasefield Ct NE Unit 1
- 3564 Courtfield Trace NE Unit 11
- 3419 Chastain Glen Ln NE
- 3427 Chastain Glen Ln NE
- 0 Chasefield Ct Unit 7123364
- 3543 Chasefield Way NE Unit 1
- 3421 Chastain Glen Ln NE
- 632 Chasefield Ct NE Unit 1
- 3566 Courtfield Trace NE Unit 2