Estimated Value: $422,000 - $527,000
--
Bed
--
Bath
1,647
Sq Ft
$276/Sq Ft
Est. Value
About This Home
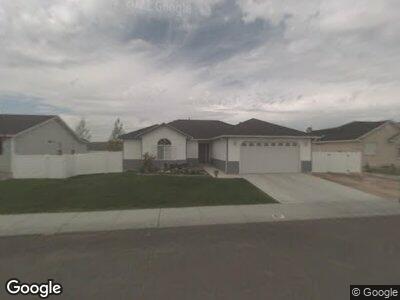
This home is located at 3537 Ridgecrest Dr, Elko, NV 89801 and is currently estimated at $455,067, approximately $276 per square foot. 3537 Ridgecrest Dr is a home located in Elko County with nearby schools including Mountain View Elementary School, Adobe Middle School, and Flagview Intermediate School.
Ownership History
Date
Name
Owned For
Owner Type
Purchase Details
Closed on
Aug 25, 2017
Sold by
Bell Shawn L and Bell Natalya
Bought by
Bell Shawn L and Bell Natalya N
Current Estimated Value
Purchase Details
Closed on
Mar 4, 2008
Sold by
Sirva Relocation Credit Llc
Bought by
Bell Shawn L and Bell Natalya
Home Financials for this Owner
Home Financials are based on the most recent Mortgage that was taken out on this home.
Original Mortgage
$275,000
Interest Rate
5.41%
Mortgage Type
Purchase Money Mortgage
Purchase Details
Closed on
Mar 1, 2008
Sold by
Donnelli Daniel S and Donnelli Amber
Bought by
Sirva Relocation Credit Llc
Home Financials for this Owner
Home Financials are based on the most recent Mortgage that was taken out on this home.
Original Mortgage
$275,000
Interest Rate
5.41%
Mortgage Type
Purchase Money Mortgage
Create a Home Valuation Report for This Property
The Home Valuation Report is an in-depth analysis detailing your home's value as well as a comparison with similar homes in the area
Home Values in the Area
Average Home Value in this Area
Purchase History
| Date | Buyer | Sale Price | Title Company |
|---|---|---|---|
| Bell Shawn L | -- | None Available | |
| Bell Shawn L | $344,000 | Stewart Title Elko | |
| Sirva Relocation Credit Llc | $344,000 | Stewart Title Elko |
Source: Public Records
Mortgage History
| Date | Status | Borrower | Loan Amount |
|---|---|---|---|
| Open | Bell Shawn L | $256,000 | |
| Closed | Bell Shawn L | $265,688 | |
| Closed | Bell Shawn L | $275,000 | |
| Previous Owner | Donnelli Daniel S | $120,875 | |
| Previous Owner | Donnelli Daniel S | $55,000 |
Source: Public Records
Tax History Compared to Growth
Tax History
| Year | Tax Paid | Tax Assessment Tax Assessment Total Assessment is a certain percentage of the fair market value that is determined by local assessors to be the total taxable value of land and additions on the property. | Land | Improvement |
|---|---|---|---|---|
| 2024 | $3,035 | $95,218 | $15,750 | $79,468 |
| 2023 | $2,762 | $90,258 | $15,750 | $74,508 |
| 2022 | $2,682 | $79,098 | $15,750 | $63,348 |
| 2021 | $2,604 | $77,365 | $15,750 | $61,615 |
| 2020 | $2,531 | $74,571 | $12,250 | $62,321 |
| 2019 | $2,445 | $70,195 | $12,250 | $57,945 |
| 2018 | $2,451 | $70,353 | $12,250 | $58,103 |
| 2017 | $2,416 | $69,339 | $12,250 | $57,089 |
| 2016 | $2,441 | $69,340 | $12,250 | $57,090 |
| 2015 | $2,398 | $68,474 | $12,250 | $56,224 |
| 2014 | $2,330 | $65,764 | $12,250 | $53,514 |
Source: Public Records
Map
Nearby Homes
- 304 Rolling Hills Dr
- 222 Rolling Hills Dr
- 3534 Hawthorne Dr
- 317 Forest Ln
- 3706 Valley Ridge Ave
- 0 N 5th St
- 211 Copper St
- 2041 Eagle Ridge Loop Unit 11
- 2045 Eagle Ridge Loop Unit 12
- 9999 5th St
- 654 Cortney Dr
- 425 Cottonwood Dr
- 3079 La Nae Dr
- 3020 Callie Ct
- 0 Bluffs Ave
- 2990 Aria Way
- 3221 Jennings Way
- 2905 Aria Way
- 2902 Aria Way
- 2611 Platinum Dr
- 3537 Ridgecrest Dr
- 3533 Ridgecrest Dr
- 3541 Ridgecrest Dr
- 314 Oakridge Dr
- 3529 Ridgecrest Dr
- 3540 Ridgecrest Dr
- 310 Oakridge Dr
- 402 Rolling Hills Dr
- 3528 Ridgecrest Dr
- 3525 Ridgecrest Dr
- 316 Rolling Hills Dr
- 307 Rolling Hills Dr
- 306 Oakridge Dr
- 3524 Ridgecrest Dr
- 309 Oakridge Dr
- 3521 Ridgecrest Dr
- 3515 Wright Way
- 3608 Wright Way
- 319 Brookwood Dr
- 3520 Ridgecrest Dr