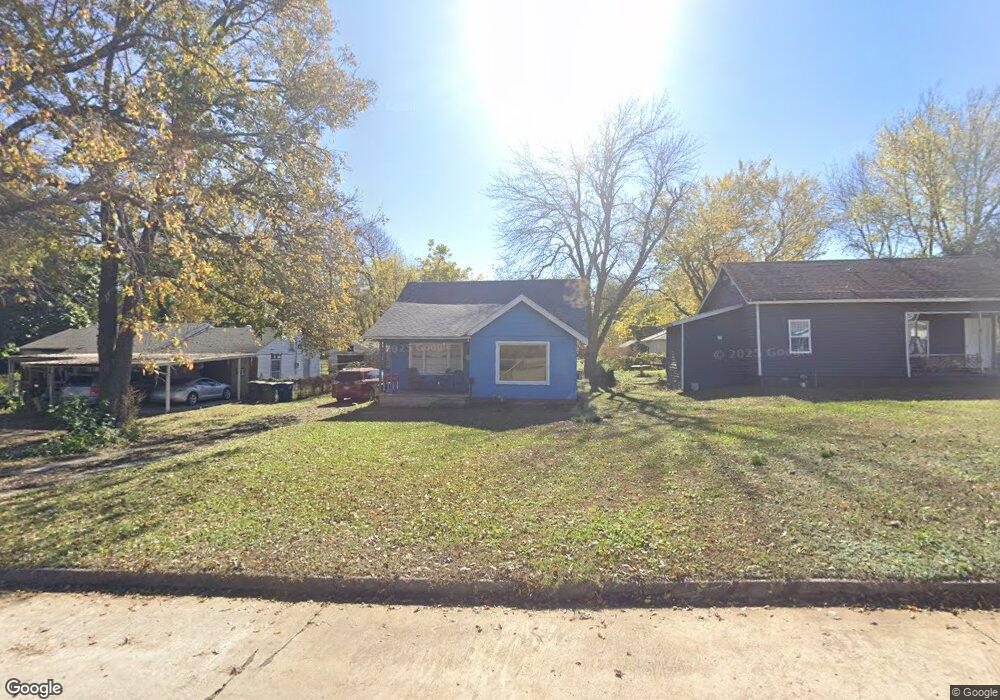
3538 E Latimer Place Tulsa, OK 74115
Sequoyah NeighborhoodEstimated Value: $73,356 - $105,000
Studio
1
Bath
902
Sq Ft
$95/Sq Ft
Est. Value
About This Home
This home is located at 3538 E Latimer Place, Tulsa, OK 74115 and is currently estimated at $85,839, approximately $95 per square foot. 3538 E Latimer Place is a home located in Tulsa County with nearby schools including Owen Elementary School, Nathan Hale High School, and Tulsa Adventist Academy.
Ownership History
Date
Name
Owned For
Owner Type
Purchase Details
Closed on
Jul 5, 2022
Sold by
Kaye Hintz Danny
Bought by
Dkh Revocable Trust
Current Estimated Value
Purchase Details
Closed on
Nov 12, 2008
Sold by
Scott Albert B and Scott Karen C
Bought by
Hintz Danny Kaye
Purchase Details
Closed on
Sep 4, 2008
Sold by
Scott Albert B and Scott Karen C
Bought by
Hintz Danny Kaye
Home Financials for this Owner
Home Financials are based on the most recent Mortgage that was taken out on this home.
Original Mortgage
$40,000
Interest Rate
10%
Mortgage Type
Seller Take Back
Purchase Details
Closed on
Mar 6, 2000
Sold by
Freeman Karen and Scott Karen
Bought by
Scott Albert Bryan
Home Financials for this Owner
Home Financials are based on the most recent Mortgage that was taken out on this home.
Original Mortgage
$18,360
Interest Rate
8.21%
Mortgage Type
Purchase Money Mortgage
Create a Home Valuation Report for This Property
The Home Valuation Report is an in-depth analysis detailing your home's value as well as a comparison with similar homes in the area
Home Values in the Area
Average Home Value in this Area
Purchase History
| Date | Buyer | Sale Price | Title Company |
|---|---|---|---|
| Dkh Revocable Trust | -- | None Listed On Document | |
| Hintz Danny Kaye | -- | None Available | |
| Hintz Danny Kaye | $45,000 | None Available | |
| Scott Albert Bryan | -- | Midwest Title Service |
Source: Public Records
Mortgage History
| Date | Status | Borrower | Loan Amount |
|---|---|---|---|
| Previous Owner | Hintz Danny Kaye | $40,000 | |
| Previous Owner | Scott Albert Bryan | $18,360 |
Source: Public Records
Tax History
| Year | Tax Paid | Tax Assessment Tax Assessment Total Assessment is a certain percentage of the fair market value that is determined by local assessors to be the total taxable value of land and additions on the property. | Land | Improvement |
|---|---|---|---|---|
| 2025 | $706 | $5,272 | $940 | $4,332 |
| 2024 | $607 | $5,021 | $1,075 | $3,946 |
| 2023 | $607 | $4,782 | $1,126 | $3,656 |
| 2022 | $607 | $4,554 | $1,287 | $3,267 |
| 2021 | $601 | $4,554 | $1,287 | $3,267 |
| 2020 | $593 | $4,554 | $1,287 | $3,267 |
| 2019 | $624 | $4,554 | $1,287 | $3,267 |
| 2018 | $625 | $4,554 | $1,287 | $3,267 |
| 2017 | $624 | $4,554 | $1,287 | $3,267 |
| 2016 | $611 | $4,554 | $1,287 | $3,267 |
| 2015 | $613 | $4,554 | $1,287 | $3,267 |
| 2014 | $607 | $4,554 | $1,287 | $3,267 |
Source: Public Records
Map
Nearby Homes
- 1055 N New Haven Ave
- 1049 N Oswego Ave
- 3315 E King Place
- 815 N Oswego Ave
- 1339 N Richmond Ave
- 3219 E Oklahoma Place
- 3203 E Oklahoma Place
- 1231 N Toledo Ave
- 1348 N Toledo Ave
- 1551 N Indianapolis Ave
- 1043 N College Ave
- 1717 N Harvard Ave
- 3523 E Admiral Ct
- 3911 E Admiral Ct
- 855 N Delaware Place
- 4729 E King St
- 1525 N College Ave
- 3310 E Admiral Ct
- 141 N College Ave
- 1814 N Jamestown Ave
- 3546 E Latimer Place
- 3536 E Latimer Place
- 3537 E Latimer St
- 3530 E Latimer Place
- 3533 E Latimer St
- 3529 E Latimer St
- 3533 E Latimer Place
- 3539 E Latimer Place
- 3525 E Latimer Place
- 1050 N Louisville Ave
- 3701 E Latimer Place
- 3542 E Latimer St
- 3538 E Latimer St
- 3517 E Latimer Place
- 3534 E Latimer St
- 1048 N Louisville Ave
- 3530 E Latimer St
- 3526 E Latimer St
- 1044 N Louisville Ave
- 1051 N Louisville Ave
Your Personal Tour Guide
Ask me questions while you tour the home.