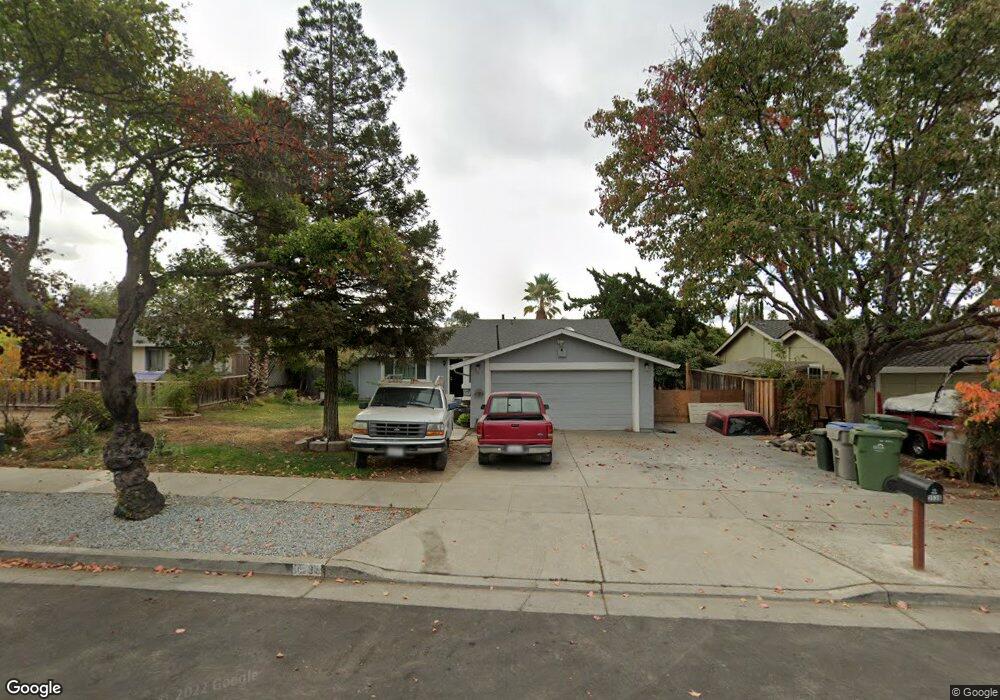
3538 Pine Ridge Way San Jose, CA 95127
East Foothills NeighborhoodEstimated Value: $1,036,000 - $1,274,000
4
Beds
2
Baths
1,424
Sq Ft
$811/Sq Ft
Est. Value
About This Home
This home is located at 3538 Pine Ridge Way, San Jose, CA 95127 and is currently estimated at $1,155,373, approximately $811 per square foot. 3538 Pine Ridge Way is a home located in Santa Clara County with nearby schools including Mt. Pleasant High School, Voices College-Bound Language Academy at Mt. Pleasant, and B. Roberto Cruz Leadership Academy.
Ownership History
Date
Name
Owned For
Owner Type
Purchase Details
Closed on
Dec 17, 2002
Sold by
Medina Ruby and Rivera Albertina
Bought by
Rivera Albertina
Current Estimated Value
Home Financials for this Owner
Home Financials are based on the most recent Mortgage that was taken out on this home.
Original Mortgage
$372,000
Outstanding Balance
$156,454
Interest Rate
5.95%
Estimated Equity
$998,919
Purchase Details
Closed on
Nov 21, 2000
Sold by
Medina John and Medina Merlinda
Bought by
Medina Ruby and Rivera Albertina
Home Financials for this Owner
Home Financials are based on the most recent Mortgage that was taken out on this home.
Original Mortgage
$345,600
Interest Rate
8.87%
Purchase Details
Closed on
Dec 16, 1993
Sold by
Coast Federal Bank
Bought by
Medina John and Medina Merlinda
Home Financials for this Owner
Home Financials are based on the most recent Mortgage that was taken out on this home.
Original Mortgage
$165,300
Interest Rate
3.5%
Create a Home Valuation Report for This Property
The Home Valuation Report is an in-depth analysis detailing your home's value as well as a comparison with similar homes in the area
Home Values in the Area
Average Home Value in this Area
Purchase History
| Date | Buyer | Sale Price | Title Company |
|---|---|---|---|
| Rivera Albertina | $232,500 | Alliance Title Company | |
| Medina Ruby | $432,000 | Fidelity National Title Co | |
| Medina John | $174,000 | Stewart Title Of California |
Source: Public Records
Mortgage History
| Date | Status | Borrower | Loan Amount |
|---|---|---|---|
| Open | Rivera Albertina | $372,000 | |
| Closed | Medina Ruby | $345,600 | |
| Closed | Medina John | $165,300 | |
| Closed | Medina Ruby | $86,400 | |
| Closed | Rivera Albertina | $93,000 |
Source: Public Records
Tax History Compared to Growth
Tax History
| Year | Tax Paid | Tax Assessment Tax Assessment Total Assessment is a certain percentage of the fair market value that is determined by local assessors to be the total taxable value of land and additions on the property. | Land | Improvement |
|---|---|---|---|---|
| 2025 | $9,630 | $650,560 | $256,152 | $394,408 |
| 2024 | $9,630 | $637,805 | $251,130 | $386,675 |
| 2023 | $9,282 | $625,300 | $246,206 | $379,094 |
| 2022 | $9,200 | $613,040 | $241,379 | $371,661 |
| 2021 | $9,234 | $601,021 | $236,647 | $364,374 |
| 2020 | $8,865 | $594,859 | $234,221 | $360,638 |
| 2019 | $8,644 | $583,196 | $229,629 | $353,567 |
| 2018 | $8,407 | $571,762 | $225,127 | $346,635 |
| 2017 | $8,294 | $560,552 | $220,713 | $339,839 |
| 2016 | $8,035 | $549,562 | $216,386 | $333,176 |
| 2015 | $8,036 | $541,308 | $213,136 | $328,172 |
| 2014 | $7,313 | $519,200 | $204,400 | $314,800 |
Source: Public Records
Map
Nearby Homes
- 3416 Mount Mckinley Ct
- 3549 Columbine Dr
- 3382 Mount Wilson Dr
- 3472 Kaylene Dr
- 3514 Ramstad Dr
- 1702 Mount Rushmore Dr
- 1310 Park Pleasant Cir
- 10150 Clayton Rd
- 3440 Rubion Dr
- 1925 Winding Creek Ct
- 3305 Hickerson Dr
- 1245 Fleming Ave
- 3457 Ramstad Dr
- 14862 Watters Dr
- 10230 Griffith St
- 14440 Victoria Ct
- 1122 Lancelot Ln
- 3250 Sylvan Dr
- 10281 Murtha Dr
- 3434 Dominick Ct
- 3530 Pine Ridge Way
- 3548 Pine Ridge Way
- 1580 Clayton Rd
- 3522 Pine Ridge Way
- 1586 Clayton Rd
- 1574 Clayton Rd
- 3554 Pine Ridge Way
- 3531 Pine Ridge Way
- 3539 Pine Ridge Way
- 1592 Clayton Rd
- 3514 Pine Ridge Way
- 3523 Pine Ridge Way
- 3547 Pine Ridge Way
- 3586 Pine Ridge Way
- 1562 Clayton Rd
- 3515 Pine Ridge Way
- 3555 Pine Ridge Way
- 3508 Pine Ridge Way
- 3592 Pine Ridge Way
- 3507 Pine Ridge Way