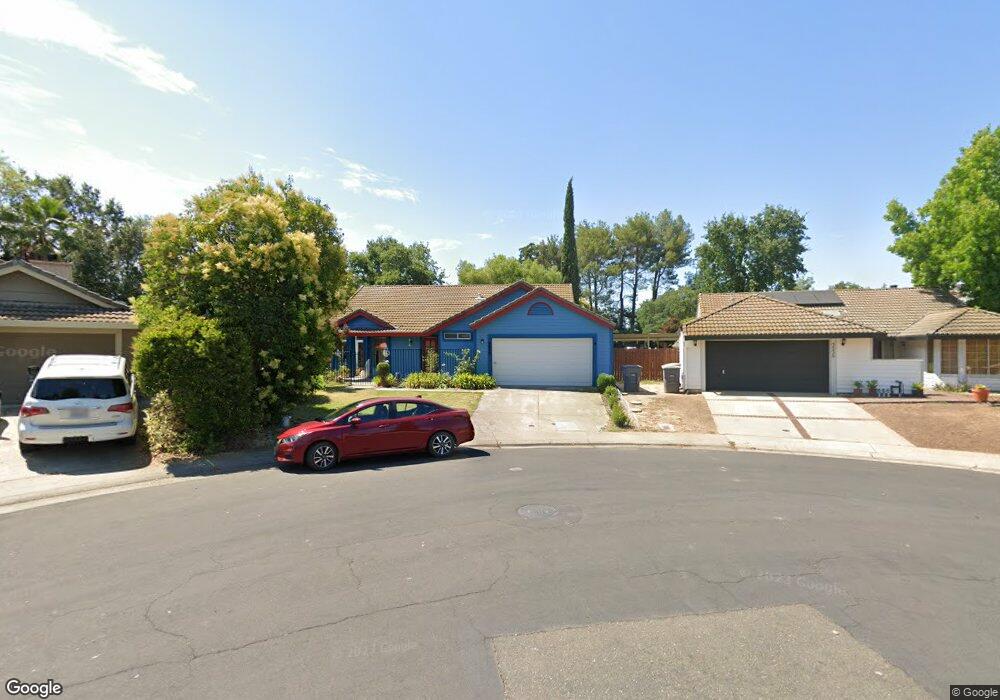
3538 Willard Way Rocklin, CA 95677
Central Rocklin NeighborhoodEstimated Value: $447,000 - $516,000
3
Beds
2
Baths
1,186
Sq Ft
$412/Sq Ft
Est. Value
About This Home
This home is located at 3538 Willard Way, Rocklin, CA 95677 and is currently estimated at $488,333, approximately $411 per square foot. 3538 Willard Way is a home located in Placer County with nearby schools including Parker Whitney Elementary School, Spring View Middle School, and Rocklin High.
Ownership History
Date
Name
Owned For
Owner Type
Purchase Details
Closed on
Feb 13, 2024
Sold by
Anthony Mark
Bought by
Anthony Yvonne M
Current Estimated Value
Home Financials for this Owner
Home Financials are based on the most recent Mortgage that was taken out on this home.
Original Mortgage
$750,000
Outstanding Balance
$719,966
Interest Rate
1.5%
Mortgage Type
Reverse Mortgage Home Equity Conversion Mortgage
Estimated Equity
-$231,633
Purchase Details
Closed on
Jul 24, 2012
Sold by
Perry Yvonne M and Izaguirre Yvonne M
Bought by
Perry Yvonne M
Home Financials for this Owner
Home Financials are based on the most recent Mortgage that was taken out on this home.
Original Mortgage
$85,635
Interest Rate
2.5%
Mortgage Type
New Conventional
Create a Home Valuation Report for This Property
The Home Valuation Report is an in-depth analysis detailing your home's value as well as a comparison with similar homes in the area
Home Values in the Area
Average Home Value in this Area
Purchase History
| Date | Buyer | Sale Price | Title Company |
|---|---|---|---|
| Anthony Yvonne M | -- | Placer Title | |
| Anthony Yvonne M | -- | Placer Title | |
| Anthony Yvonne M | -- | Placer Title | |
| Perry Yvonne M | -- | First American Equity Loan S |
Source: Public Records
Mortgage History
| Date | Status | Borrower | Loan Amount |
|---|---|---|---|
| Open | Anthony Yvonne M | $750,000 | |
| Closed | Anthony Yvonne M | $750,000 | |
| Closed | Anthony Yvonne M | $750,000 | |
| Previous Owner | Perry Yvonne M | $85,635 |
Source: Public Records
Tax History Compared to Growth
Tax History
| Year | Tax Paid | Tax Assessment Tax Assessment Total Assessment is a certain percentage of the fair market value that is determined by local assessors to be the total taxable value of land and additions on the property. | Land | Improvement |
|---|---|---|---|---|
| 2025 | $2,222 | $199,183 | $58,858 | $140,325 |
| 2023 | $2,222 | $191,450 | $56,573 | $134,877 |
| 2022 | $2,151 | $187,697 | $55,464 | $132,233 |
| 2021 | $2,128 | $184,018 | $54,377 | $129,641 |
| 2020 | $2,125 | $182,132 | $53,820 | $128,312 |
| 2019 | $2,345 | $178,562 | $52,765 | $125,797 |
| 2018 | $2,043 | $175,062 | $51,731 | $123,331 |
| 2017 | $2,137 | $171,630 | $50,717 | $120,913 |
| 2016 | $1,987 | $168,266 | $49,723 | $118,543 |
| 2015 | $1,963 | $165,740 | $48,977 | $116,763 |
| 2014 | $1,929 | $162,494 | $48,018 | $114,476 |
Source: Public Records
Map
Nearby Homes
- 3540 Farron St
- 5922 Allan Dr
- 5742 Shannon Bay Dr
- 5810 Elmwood Ct
- 3707 Cone Ct
- 4010 Della Ct
- 6195 Rainier Ave
- 5225 5th St
- 5505 S Grove St Unit 101
- 5505 S Grove St Unit 45
- 5505 S Grove St Unit 203
- 5505 S Grove St Unit 119
- 2586 Pinnacles Dr
- 3023 Twin Creeks Ln
- 2685 S Whitney Blvd
- 5636 Butano Way
- 4166 Oakmont St Unit 197
- 4137 Oakmont St
- 5500- China Garden Rd
- 6335 Rustic Hills Dr
- 3540 Willard Way
- 3536 Willard Way
- 3542 Willard Way
- 3534 Willard Way
- 3535 Willard Way
- 3544 Willard Way
- 3532 Willard Way
- 3533 Willard Way
- 3546 Willard Way Unit 95677
- 3546 Willard Way
- 5630 Delano Way
- 3530 Willard Way
- 3531 Willard Way
- 3548 Willard Way
- 3529 Willard Way
- 3528 Willard Way
- 5626 Delano Way
- 3550 Willard Way
- 3527 Willard Way
- 3526 Willard Way