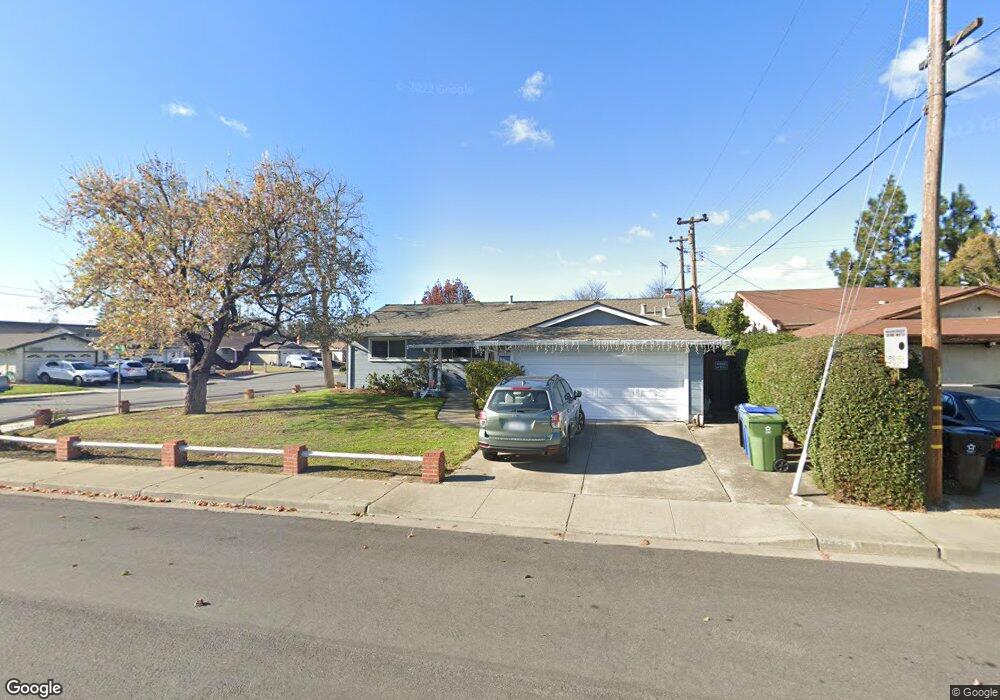
35382 Roca Dr Fremont, CA 94536
Cabrillo NeighborhoodEstimated Value: $1,341,014 - $1,609,000
3
Beds
2
Baths
1,387
Sq Ft
$1,074/Sq Ft
Est. Value
About This Home
This home is located at 35382 Roca Dr, Fremont, CA 94536 and is currently estimated at $1,490,254, approximately $1,074 per square foot. 35382 Roca Dr is a home located in Alameda County with nearby schools including Patterson Elementary School, Thornton Middle School, and American High School.
Ownership History
Date
Name
Owned For
Owner Type
Purchase Details
Closed on
Jan 9, 1996
Sold by
Tenbosch Adriaan C and Tenbosch Frida C
Bought by
Tenbosch Adriaan C and Tenbosch Frida C
Current Estimated Value
Create a Home Valuation Report for This Property
The Home Valuation Report is an in-depth analysis detailing your home's value as well as a comparison with similar homes in the area
Home Values in the Area
Average Home Value in this Area
Purchase History
| Date | Buyer | Sale Price | Title Company |
|---|---|---|---|
| Tenbosch Adriaan C | -- | -- |
Source: Public Records
Tax History
| Year | Tax Paid | Tax Assessment Tax Assessment Total Assessment is a certain percentage of the fair market value that is determined by local assessors to be the total taxable value of land and additions on the property. | Land | Improvement |
|---|---|---|---|---|
| 2025 | $4,294 | $312,825 | $94,599 | $225,226 |
| 2024 | $4,294 | $306,556 | $92,744 | $220,812 |
| 2023 | $4,164 | $307,408 | $90,926 | $216,482 |
| 2022 | $1,459 | $63,466 | $19,869 | $50,597 |
| 2021 | $1,430 | $62,084 | $19,479 | $49,605 |
| 2020 | $1,336 | $68,376 | $19,280 | $49,096 |
| 2019 | $1,325 | $67,036 | $18,902 | $48,134 |
| 2018 | $1,295 | $65,721 | $18,531 | $47,190 |
| 2017 | $1,262 | $64,433 | $18,168 | $46,265 |
| 2016 | $1,224 | $63,169 | $17,811 | $45,358 |
| 2015 | $1,192 | $62,221 | $17,544 | $44,677 |
| 2014 | $1,160 | $61,001 | $17,200 | $43,801 |
Source: Public Records
Map
Nearby Homes
- 35345 Cabral Dr
- 35172 Lancero St
- 4628 Capitan Dr
- 35605 Scarborough Dr
- 4987 Winchester Place
- 5136 Ramsgate Dr
- 4251 Jacinto Dr
- 5030 Chelsea Dr
- 4862 Garnet Common
- 4055 Grama Terrace
- 34607 Pueblo Terrace
- 4347 San Juan Ave
- 36347 Magellan Dr
- 34565 Pueblo Terrace
- 36302 Tunbridge Dr
- 34597 Bluestone Common
- 5298 Sussex Place
- 34936 Machado Common
- 35415 Blackburn Dr
- 34590 Falls Terrace
- 35386 Roca Dr
- 35392 Roca Dr
- 35388 Cabral Dr
- 35359 Cabral Dr
- 35417 Roca Dr
- 35373 Cabral Dr
- 35398 Roca Dr
- 35416 Cabral Dr
- 35387 Cabral Dr
- 35331 Cabral Dr
- 35423 Roca Dr
- 4574 Angeles Ave
- 35415 Cabral Dr
- 35440 Cabral Dr
- 35289 Cabral Dr
- 35404 Roca Dr
- 4568 Angeles Ave
- 35429 Roca Dr
- 35317 Cabral Dr
- 35303 Cabral Dr
Your Personal Tour Guide
Ask me questions while you tour the home.