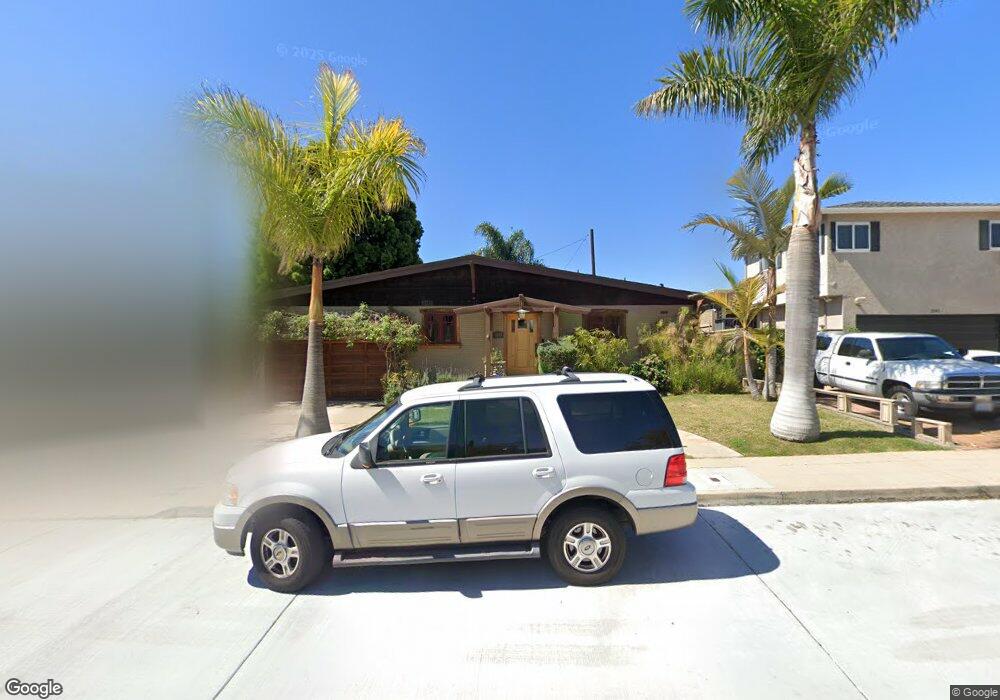
3539 Curtis St San Diego, CA 92106
Loma Portal NeighborhoodEstimated Value: $1,588,806 - $1,793,000
4
Beds
2
Baths
1,872
Sq Ft
$888/Sq Ft
Est. Value
About This Home
This home is located at 3539 Curtis St, San Diego, CA 92106 and is currently estimated at $1,661,952, approximately $887 per square foot. 3539 Curtis St is a home located in San Diego County with nearby schools including Loma Portal Elementary School, Richard Henry Dana Middle School, and Correia Middle School.
Ownership History
Date
Name
Owned For
Owner Type
Purchase Details
Closed on
Nov 28, 2017
Sold by
Vogt Axel Lee
Bought by
Vogt Axel Lee and The Axel Vogt Revocable Trust
Current Estimated Value
Purchase Details
Closed on
May 31, 2007
Sold by
Vogt Axel Lee
Bought by
Vogt Axel Lee
Home Financials for this Owner
Home Financials are based on the most recent Mortgage that was taken out on this home.
Original Mortgage
$720,000
Outstanding Balance
$450,727
Interest Rate
6.62%
Mortgage Type
New Conventional
Estimated Equity
$1,211,225
Purchase Details
Closed on
Mar 11, 2004
Sold by
Harrow Bernard J
Bought by
Vogt Axel Lee
Home Financials for this Owner
Home Financials are based on the most recent Mortgage that was taken out on this home.
Original Mortgage
$517,500
Interest Rate
6.12%
Mortgage Type
Purchase Money Mortgage
Purchase Details
Closed on
Feb 12, 2002
Sold by
Harrow Bernard J and Harrow Sylvia M
Bought by
Harrow Bernard J
Create a Home Valuation Report for This Property
The Home Valuation Report is an in-depth analysis detailing your home's value as well as a comparison with similar homes in the area
Home Values in the Area
Average Home Value in this Area
Purchase History
| Date | Buyer | Sale Price | Title Company |
|---|---|---|---|
| Vogt Axel Lee | -- | None Available | |
| Vogt Axel Lee | -- | California Title Co | |
| Vogt Axel Lee | $626,000 | California Title Company | |
| Harrow Bernard J | -- | -- |
Source: Public Records
Mortgage History
| Date | Status | Borrower | Loan Amount |
|---|---|---|---|
| Open | Vogt Axel Lee | $720,000 | |
| Closed | Vogt Axel Lee | $517,500 |
Source: Public Records
Tax History Compared to Growth
Tax History
| Year | Tax Paid | Tax Assessment Tax Assessment Total Assessment is a certain percentage of the fair market value that is determined by local assessors to be the total taxable value of land and additions on the property. | Land | Improvement |
|---|---|---|---|---|
| 2025 | $11,173 | $923,518 | $781,978 | $141,540 |
| 2024 | $11,173 | $905,411 | $766,646 | $138,765 |
| 2023 | $10,925 | $887,659 | $751,614 | $136,045 |
| 2022 | $10,635 | $870,255 | $736,877 | $133,378 |
| 2021 | $10,561 | $853,192 | $722,429 | $130,763 |
| 2020 | $10,433 | $844,445 | $715,022 | $129,423 |
| 2019 | $10,247 | $827,888 | $701,002 | $126,886 |
| 2018 | $9,581 | $811,656 | $687,257 | $124,399 |
| 2017 | $9,271 | $795,742 | $673,782 | $121,960 |
| 2016 | $9,123 | $780,140 | $660,571 | $119,569 |
| 2015 | $8,987 | $768,422 | $650,649 | $117,773 |
| 2014 | $8,844 | $753,370 | $637,904 | $115,466 |
Source: Public Records
Map
Nearby Homes
- 3616 Zola St
- 2675 Clove St
- 3345 Elliott St
- 3615 Lotus Dr
- 2409 Evergreen St
- 2359 Caminito Agrado
- 3033 Browning St
- 3761 Oleander Dr
- 4021 Caminito Dehesa
- 2812 Poinsettia Dr
- 3111 Ibsen St
- 2284 Caminito Pajarito Unit 147
- 2373 Caminito Afuera
- 2658 Worden St Unit 232
- 4012 Valeta St Unit 304
- 2640 Worden St Unit 207
- 2666 Worden St Unit 8
- 2205 Locust St
- 3805 Atascadero Dr
- 3322 Russell St
- 3531 Curtis St
- 3545 Curtis St
- 3542 Browning St
- 2507 Chatsworth Blvd
- 3530 Browning St
- 3521 Curtis St
- 3520 Browning St
- 3538 Curtis St
- 3542 Curtis St
- 3511 Curtis St
- 3530 Curtis St
- 2555 Chatsworth Blvd
- 3512 Browning St
- 3520 Curtis St
- 2526 Clove St
- 3512 Curtis St
- 3504 Browning St
- 2540 Chatsworth Blvd
- 2526 Chatsworth Blvd
- 3545 Browning St