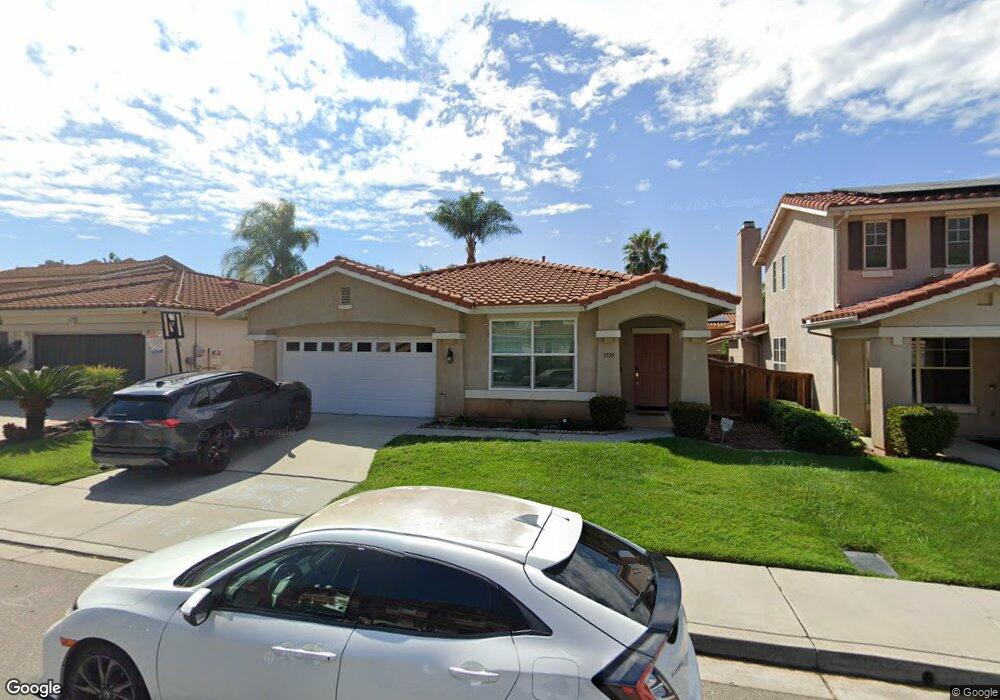
3539 Lake Park Ave Fallbrook, CA 92028
Estimated Value: $713,980 - $757,000
3
Beds
2
Baths
1,717
Sq Ft
$430/Sq Ft
Est. Value
About This Home
This home is located at 3539 Lake Park Ave, Fallbrook, CA 92028 and is currently estimated at $737,745, approximately $429 per square foot. 3539 Lake Park Ave is a home located in San Diego County with nearby schools including Bonsall Elementary School, Sullivan Middle School, and Bonsall High.
Ownership History
Date
Name
Owned For
Owner Type
Purchase Details
Closed on
Aug 28, 2024
Sold by
Dondey Craig R and Dondey Deanna M
Bought by
Craig R Dondey And Deanna M Dondey Family Tru and Dondey
Current Estimated Value
Purchase Details
Closed on
Jun 4, 2010
Sold by
Azevedo Family Trust
Bought by
Dondey Craig R and Dondey Deanna M
Home Financials for this Owner
Home Financials are based on the most recent Mortgage that was taken out on this home.
Original Mortgage
$301,342
Interest Rate
4.82%
Mortgage Type
VA
Purchase Details
Closed on
Dec 18, 2001
Sold by
Young Rita Marie
Bought by
Azevedo Mary
Purchase Details
Closed on
Jul 17, 2000
Sold by
Meadow Creek Homes Llc
Bought by
Young Rita Marie
Home Financials for this Owner
Home Financials are based on the most recent Mortgage that was taken out on this home.
Original Mortgage
$140,000
Interest Rate
8.19%
Create a Home Valuation Report for This Property
The Home Valuation Report is an in-depth analysis detailing your home's value as well as a comparison with similar homes in the area
Home Values in the Area
Average Home Value in this Area
Purchase History
| Date | Buyer | Sale Price | Title Company |
|---|---|---|---|
| Craig R Dondey And Deanna M Dondey Family Tru | -- | None Listed On Document | |
| Dondey Craig R | $295,000 | American Coast Title | |
| Azevedo Mary | $240,000 | Chicago Title Co | |
| Young Rita Marie | $202,000 | Commonwealth Land Title Co |
Source: Public Records
Mortgage History
| Date | Status | Borrower | Loan Amount |
|---|---|---|---|
| Previous Owner | Dondey Craig R | $301,342 | |
| Previous Owner | Young Rita Marie | $140,000 |
Source: Public Records
Tax History Compared to Growth
Tax History
| Year | Tax Paid | Tax Assessment Tax Assessment Total Assessment is a certain percentage of the fair market value that is determined by local assessors to be the total taxable value of land and additions on the property. | Land | Improvement |
|---|---|---|---|---|
| 2025 | $3,918 | $377,934 | $188,197 | $189,737 |
| 2024 | $3,918 | $370,524 | $184,507 | $186,017 |
| 2023 | $3,832 | $363,260 | $180,890 | $182,370 |
| 2022 | $3,766 | $356,139 | $177,344 | $178,795 |
| 2021 | $3,705 | $349,157 | $173,867 | $175,290 |
| 2020 | $3,679 | $345,578 | $172,085 | $173,493 |
| 2019 | $3,614 | $338,803 | $168,711 | $170,092 |
| 2018 | $3,632 | $332,160 | $165,403 | $166,757 |
| 2017 | $3,561 | $325,648 | $162,160 | $163,488 |
| 2016 | $3,478 | $319,264 | $158,981 | $160,283 |
| 2015 | $3,417 | $314,469 | $156,593 | $157,876 |
| 2014 | $3,350 | $308,310 | $153,526 | $154,784 |
Source: Public Records
Map
Nearby Homes
- 4965 Lake Shore Ct
- 3709 Lake Park Rd
- 4854 Dulin Rd
- 3848 Lake Park St
- 5058 Lake Circle Rd
- 3264 Shearer Crossing
- 4650 Dulin Rd Unit 192
- 4650 Dulin Rd Unit 121
- 4650 Dulin Rd Unit 42
- 4650 Dulin Rd Unit 208
- 4650 Dulin Rd Unit 45
- 4650 Dulin Rd Unit 162
- 4650 Dulin Rd Unit 188
- 4650 Dulin Rd Unit 126
- 4650 Dulin Rd Unit 178
- 4650 Dulin Rd Unit 119
- 4634 Silent Knoll Dr
- 34758 Criollo Way
- 3021 Jicarilla Dr
- 4434 Brodea Ln
- 3547 Lake Park Ave
- 3531 Lake Park Ave
- 3536 Lake Shore Ave
- 3555 Lake Park Ave
- 3523 Lake Park Ave
- 3544 Lake Shore Ave
- 3528 Lake Shore Ave
- 3552 Lake Shore Ave
- 3520 Lake Shore Ave
- 3538 Lake Park Ave
- 3563 Lake Park Ave
- 3530 Lake Park Ave
- 3546 Lake Park Ave
- 3515 Lake Park Ave
- 3522 Lake Park Ave
- 3560 Lake Shore Ave
- 3554 Lake Park Ave
- 3512 Lake Shore Ave
- 3571 Lake Park Ave
- 3507 Lake Park Ave