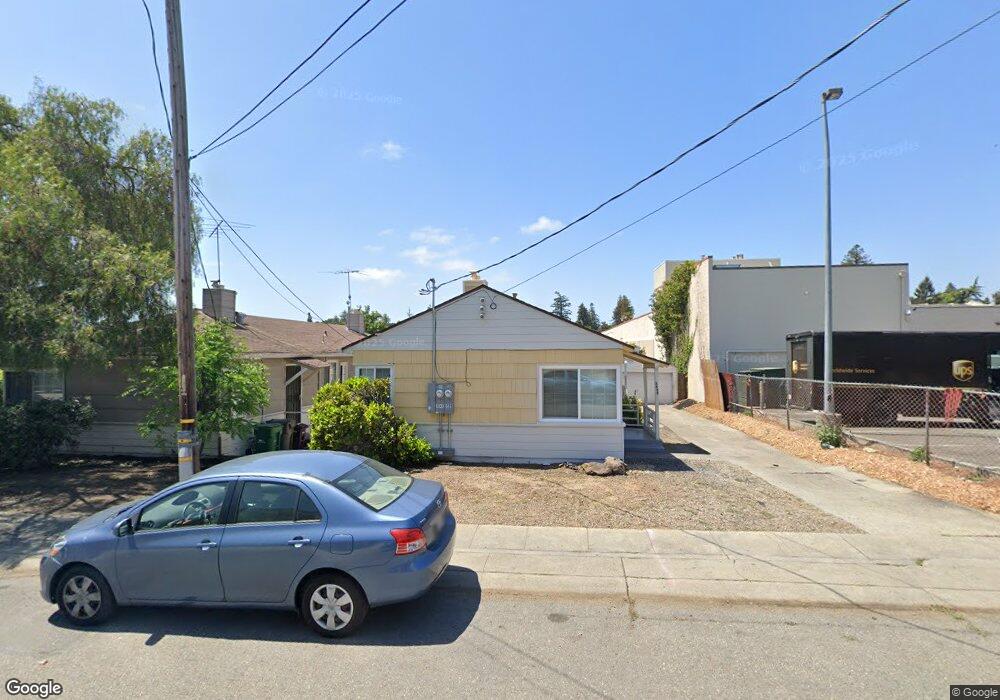
3539 May Ct Oakland, CA 94602
Dimond District NeighborhoodEstimated Value: $741,000 - $806,000
--
Bed
--
Bath
1,348
Sq Ft
$580/Sq Ft
Est. Value
About This Home
This home is located at 3539 May Ct, Oakland, CA 94602 and is currently estimated at $781,653, approximately $579 per square foot. 3539 May Ct is a home located in Alameda County with nearby schools including Sequoia Elementary School, Bret Harte Middle School, and Skyline High School.
Ownership History
Date
Name
Owned For
Owner Type
Purchase Details
Closed on
Nov 29, 2005
Sold by
May Court Investments Llc
Bought by
Chin Vincent Y and Chin Grace L
Current Estimated Value
Home Financials for this Owner
Home Financials are based on the most recent Mortgage that was taken out on this home.
Original Mortgage
$375,000
Outstanding Balance
$203,028
Interest Rate
5.75%
Mortgage Type
Purchase Money Mortgage
Estimated Equity
$578,625
Purchase Details
Closed on
Nov 13, 2002
Sold by
Kinder Co
Bought by
May Court Investments Llc
Create a Home Valuation Report for This Property
The Home Valuation Report is an in-depth analysis detailing your home's value as well as a comparison with similar homes in the area
Home Values in the Area
Average Home Value in this Area
Purchase History
| Date | Buyer | Sale Price | Title Company |
|---|---|---|---|
| Chin Vincent Y | $500,000 | Chicago Title Co | |
| May Court Investments Llc | -- | -- |
Source: Public Records
Mortgage History
| Date | Status | Borrower | Loan Amount |
|---|---|---|---|
| Open | Chin Vincent Y | $375,000 |
Source: Public Records
Tax History Compared to Growth
Tax History
| Year | Tax Paid | Tax Assessment Tax Assessment Total Assessment is a certain percentage of the fair market value that is determined by local assessors to be the total taxable value of land and additions on the property. | Land | Improvement |
|---|---|---|---|---|
| 2025 | $10,797 | $683,230 | $204,969 | $478,261 |
| 2024 | $10,797 | $669,834 | $200,950 | $468,884 |
| 2023 | $11,297 | $656,704 | $197,011 | $459,693 |
| 2022 | $10,933 | $643,830 | $193,149 | $450,681 |
| 2021 | $10,397 | $631,210 | $189,363 | $441,847 |
| 2020 | $10,282 | $624,740 | $187,422 | $437,318 |
| 2019 | $9,859 | $612,494 | $183,748 | $428,746 |
| 2018 | $9,655 | $600,490 | $180,147 | $420,343 |
| 2017 | $9,270 | $588,720 | $176,616 | $412,104 |
| 2016 | $7,936 | $500,000 | $150,000 | $350,000 |
| 2015 | $7,997 | $500,000 | $150,000 | $350,000 |
| 2014 | $7,817 | $465,000 | $139,500 | $325,500 |
Source: Public Records
Map
Nearby Homes
- 2240 Macarthur Blvd
- 3477 Boston Ave Unit 4
- 3541 Dimond Ave
- 3220 Champion St
- 3847 Fruitvale Ave
- 3826 Lincoln Ave
- 2106 Woodbine Ave
- 2550 Pleasant St
- 2715 Macarthur Blvd
- 3887 Forest Hill Ave
- 3316 Coolidge Ave
- 1703 Macarthur Blvd
- 1701 Macarthur Blvd
- 2510 Delmer St
- 2628 School St
- 2726 Madeline St
- 3853 Rhoda Ave
- 1515 Hampel St
- 3044 Capp St