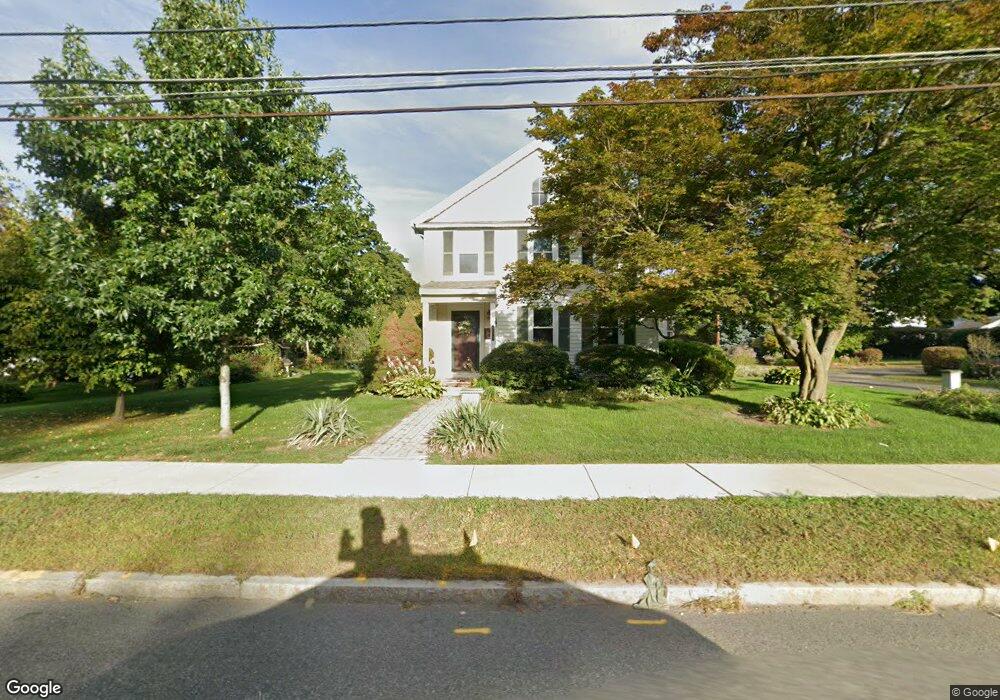
354 Bridge St Northampton, MA 01060
Estimated Value: $463,000 - $588,935
3
Beds
2
Baths
2,264
Sq Ft
$242/Sq Ft
Est. Value
About This Home
This home is located at 354 Bridge St, Northampton, MA 01060 and is currently estimated at $547,484, approximately $241 per square foot. 354 Bridge St is a home located in Hampshire County with nearby schools including Northampton High School, The Montessori School of Northampton, and Campus School of Smith College.
Ownership History
Date
Name
Owned For
Owner Type
Purchase Details
Closed on
Apr 1, 1983
Bought by
Kibe Carolyn Y
Current Estimated Value
Create a Home Valuation Report for This Property
The Home Valuation Report is an in-depth analysis detailing your home's value as well as a comparison with similar homes in the area
Home Values in the Area
Average Home Value in this Area
Purchase History
| Date | Buyer | Sale Price | Title Company |
|---|---|---|---|
| Kibe Carolyn Y | $53,500 | -- |
Source: Public Records
Mortgage History
| Date | Status | Borrower | Loan Amount |
|---|---|---|---|
| Closed | Kibe Carolyn Y | $50,000 | |
| Closed | Kibe Carolyn Y | $10,000 | |
| Closed | Kibe Carolyn Y | $40,000 |
Source: Public Records
Tax History
| Year | Tax Paid | Tax Assessment Tax Assessment Total Assessment is a certain percentage of the fair market value that is determined by local assessors to be the total taxable value of land and additions on the property. | Land | Improvement |
|---|---|---|---|---|
| 2025 | $7,721 | $554,300 | $150,200 | $404,100 |
| 2024 | $7,531 | $495,800 | $171,900 | $323,900 |
| 2023 | $7,252 | $457,800 | $156,200 | $301,600 |
| 2022 | $6,748 | $377,200 | $146,100 | $231,100 |
| 2021 | $6,363 | $366,300 | $139,200 | $227,100 |
| 2020 | $6,154 | $366,300 | $139,200 | $227,100 |
| 2019 | $6,140 | $353,500 | $139,200 | $214,300 |
| 2018 | $5,722 | $335,800 | $139,200 | $196,600 |
| 2017 | $5,605 | $335,800 | $139,200 | $196,600 |
| 2016 | $5,427 | $335,800 | $139,200 | $196,600 |
| 2015 | $5,386 | $340,900 | $131,700 | $209,200 |
| 2014 | $5,246 | $340,900 | $131,700 | $209,200 |
Source: Public Records
Map
Nearby Homes
- 35 Hubbard Ave
- 22 Woodbine Ave
- 20 View Ave Unit A
- 30 View Ave
- 50 Union St Unit 18
- 13A Finn St
- 25 Union St
- 25 Union St Unit 2
- 30 Graves Ave Unit B
- 10 Hawley St Unit 4C
- 10 Hawley St Unit 4D
- 10 Hawley St Unit 1C
- 10 Hawley St Unit 4B
- 10 Hawley St Unit 4A
- 51 Phillips Place Unit 1
- 37 Finn St
- 61 Crescent St Unit 8
- 61 Crescent St Unit 7
- 2434 Pleasant St Unit 4
- 26 Russell St Unit A-B
- 18 Coolidge Ave
- 344 Bridge St
- 374 Bridge St
- 15 Coolidge Ave
- 22 Coolidge Ave
- 347 Bridge St
- 340 Bridge St
- 10 Hubbard Ave
- 23 Coolidge Ave
- 14 Hubbard Ave
- 373 Bridge St
- 386 Bridge St
- 28 Coolidge Ave
- 5 Sherman Ave
- 355 Bridge St Unit 4B
- 355 Bridge St Unit 1A
- 336 Bridge St
- 357 Bridge St
- 337 Bridge St
- 9 Sherman Ave
Your Personal Tour Guide
Ask me questions while you tour the home.