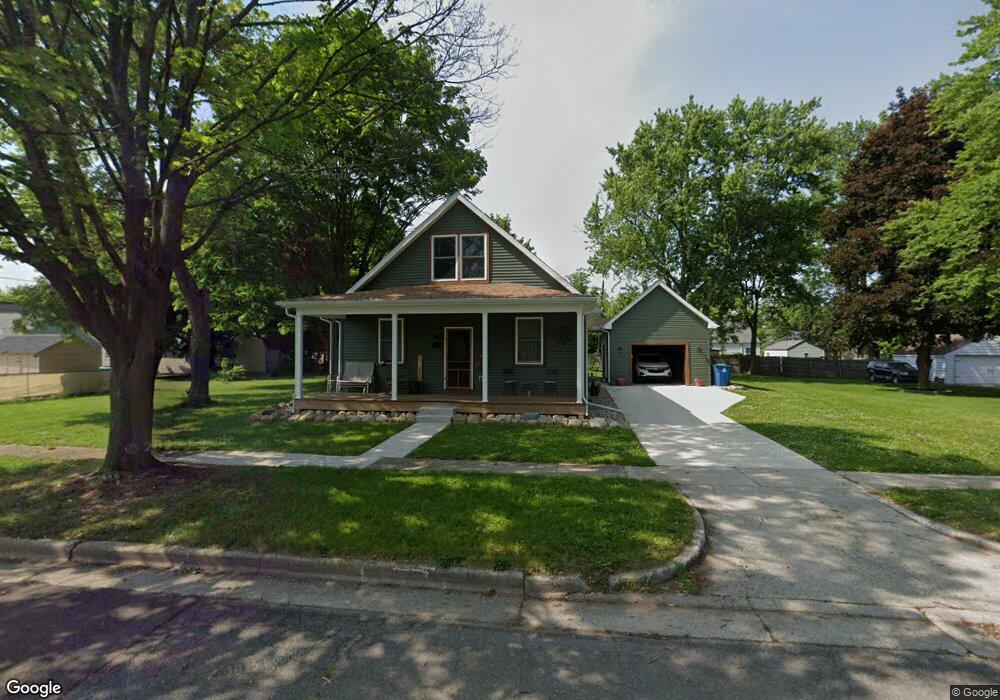
354 Burnham St W Battle Creek, MI 49015
Central Battle Creek NeighborhoodEstimated Value: $124,000 - $197,814
2
Beds
1
Bath
1,036
Sq Ft
$169/Sq Ft
Est. Value
About This Home
This home is located at 354 Burnham St W, Battle Creek, MI 49015 and is currently estimated at $175,454, approximately $169 per square foot. 354 Burnham St W is a home located in Calhoun County with nearby schools including Lakeview Middle School, Lakeview High School, and Battle Creek Montessori Academy.
Ownership History
Date
Name
Owned For
Owner Type
Purchase Details
Closed on
Oct 25, 2004
Sold by
Sams Howard G and Sams Amy M
Bought by
Buchingham Mary M
Current Estimated Value
Home Financials for this Owner
Home Financials are based on the most recent Mortgage that was taken out on this home.
Original Mortgage
$69,900
Outstanding Balance
$34,929
Interest Rate
5.8%
Mortgage Type
Purchase Money Mortgage
Estimated Equity
$140,525
Purchase Details
Closed on
Nov 13, 1998
Bought by
Sams
Create a Home Valuation Report for This Property
The Home Valuation Report is an in-depth analysis detailing your home's value as well as a comparison with similar homes in the area
Home Values in the Area
Average Home Value in this Area
Purchase History
| Date | Buyer | Sale Price | Title Company |
|---|---|---|---|
| Buchingham Mary M | $69,900 | -- | |
| Sams | $48,600 | -- |
Source: Public Records
Mortgage History
| Date | Status | Borrower | Loan Amount |
|---|---|---|---|
| Open | Buchingham Mary M | $69,900 |
Source: Public Records
Tax History Compared to Growth
Tax History
| Year | Tax Paid | Tax Assessment Tax Assessment Total Assessment is a certain percentage of the fair market value that is determined by local assessors to be the total taxable value of land and additions on the property. | Land | Improvement |
|---|---|---|---|---|
| 2025 | -- | $104,400 | $0 | $0 |
| 2024 | $3,241 | $97,124 | $0 | $0 |
| 2023 | $1,531 | $45,610 | $0 | $0 |
| 2022 | $1,214 | $37,605 | $0 | $0 |
| 2021 | $1,491 | $34,068 | $0 | $0 |
| 2020 | $1,475 | $35,240 | $0 | $0 |
| 2019 | $1,397 | $33,618 | $0 | $0 |
| 2018 | $1,397 | $32,847 | $6,089 | $26,758 |
| 2017 | $1,354 | $32,617 | $0 | $0 |
| 2016 | $1,352 | $29,871 | $0 | $0 |
| 2015 | $1,387 | $28,574 | $6,059 | $22,515 |
| 2014 | $1,387 | $31,010 | $6,059 | $24,951 |
Source: Public Records
Map
Nearby Homes
- 256 Burr St
- 387 Goguac St W
- 715 Ingram St
- 19 Ridge St
- 267 Eldred St
- 49 N La Vista Blvd
- 349 Goguac St W
- 236 Burnham St W
- 324 Goguac St W
- 760 Goguac St W
- 149 Cameron Dr
- 133 Harris St
- 64 E Grand Circle Ave
- 184 Territorial Rd W
- 9 Foster Ave
- 893 W Territorial Rd
- 178 Webber St
- 48 21st St N
- 100 Eldred St
- 132 22nd St N
- 345 Burr St
- 343 Burr St
- 349 Burr St
- 341 Burr St
- 92 N La Vista Blvd
- 90 N La Vista Blvd
- 96 N La Vista Blvd
- 340 Burnham St W
- 341 Burnham St W
- 88 N La Vista Blvd
- 100 N La Vista Blvd
- 339 Burnham St W
- 339 Burr St
- 86 N La Vista Blvd
- 323 Burr St
- 355 Burnham St W
- 324 Burnham St W
- 84 N La Vista Blvd
- 91 N La Vista Blvd
- 320 Burnham St W