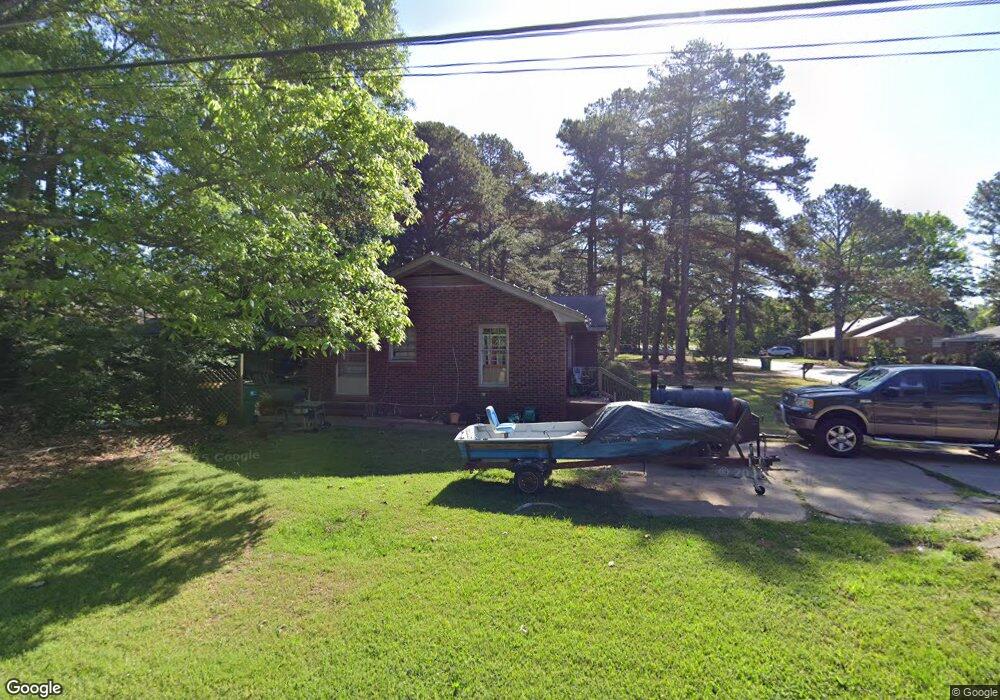
354 Emily Cir Unit B Winder, GA 30680
Estimated Value: $267,000 - $309,000
2
Beds
1
Bath
923
Sq Ft
$313/Sq Ft
Est. Value
About This Home
This home is located at 354 Emily Cir Unit B, Winder, GA 30680 and is currently estimated at $288,875, approximately $312 per square foot. 354 Emily Cir Unit B is a home located in Barrow County with nearby schools including County Line Elementary School, Russell Middle School, and Winder-Barrow High School.
Ownership History
Date
Name
Owned For
Owner Type
Purchase Details
Closed on
Jul 8, 2021
Sold by
T Square Investments 3 Llc
Bought by
Townsend James Weyman
Current Estimated Value
Home Financials for this Owner
Home Financials are based on the most recent Mortgage that was taken out on this home.
Original Mortgage
$300,000
Outstanding Balance
$237,049
Interest Rate
2.96%
Mortgage Type
New Conventional
Estimated Equity
$51,826
Purchase Details
Closed on
Sep 14, 2020
Sold by
Townsend James Weyman
Bought by
T Square Investments 3 Llc
Purchase Details
Closed on
Jan 1, 2020
Sold by
T Square Investments 3 Llc
Bought by
Townsend James Weyman
Purchase Details
Closed on
Oct 25, 2013
Sold by
Townsend Brenda M
Bought by
T Square Investments 3 Llc
Create a Home Valuation Report for This Property
The Home Valuation Report is an in-depth analysis detailing your home's value as well as a comparison with similar homes in the area
Home Values in the Area
Average Home Value in this Area
Purchase History
| Date | Buyer | Sale Price | Title Company |
|---|---|---|---|
| Townsend James Weyman | $300,000 | -- | |
| T Square Investments 3 Llc | -- | -- | |
| Townsend James Weyman | -- | -- | |
| T Square Investments 3 Llc | -- | -- |
Source: Public Records
Mortgage History
| Date | Status | Borrower | Loan Amount |
|---|---|---|---|
| Open | Townsend James Weyman | $300,000 |
Source: Public Records
Tax History Compared to Growth
Tax History
| Year | Tax Paid | Tax Assessment Tax Assessment Total Assessment is a certain percentage of the fair market value that is determined by local assessors to be the total taxable value of land and additions on the property. | Land | Improvement |
|---|---|---|---|---|
| 2024 | $2,151 | $74,279 | $10,000 | $64,279 |
| 2023 | $2,145 | $74,279 | $10,000 | $64,279 |
| 2022 | $1,703 | $47,323 | $10,000 | $37,323 |
| 2021 | $1,685 | $44,861 | $10,000 | $34,861 |
| 2020 | $1,403 | $37,477 | $10,000 | $27,477 |
| 2019 | $1,335 | $34,893 | $12,000 | $22,893 |
| 2018 | $1,300 | $34,893 | $12,000 | $22,893 |
| 2017 | $920 | $30,844 | $12,000 | $18,844 |
| 2016 | $1,018 | $29,313 | $12,000 | $17,313 |
| 2015 | $1,030 | $29,626 | $12,000 | $17,626 |
| 2014 | $843 | $23,819 | $5,880 | $17,939 |
| 2013 | -- | $25,051 | $5,880 | $19,171 |
Source: Public Records
Map
Nearby Homes
- 354 Emily Cir
- 354 Emily Cir Unit A
- 355 Lumpkin St
- 357 Emily Cir Unit A
- 357 Emily Cir
- 357 Emily Cir Unit B
- 362 Emily Cir Unit B
- 362 Emily Cir
- 362 Emily Cir Unit A
- 361 Lumpkin St
- 365 Emily Cir
- 373 Lumpkin St
- 355 Fairview Ave
- 341 Lumpkin St Unit 22
- 341 Lumpkin St
- 356 Fairview Ave
- 337 Lumpkin St
- 324 Nancy St
- 401 Missi Ln
- 333 Lumpkin St