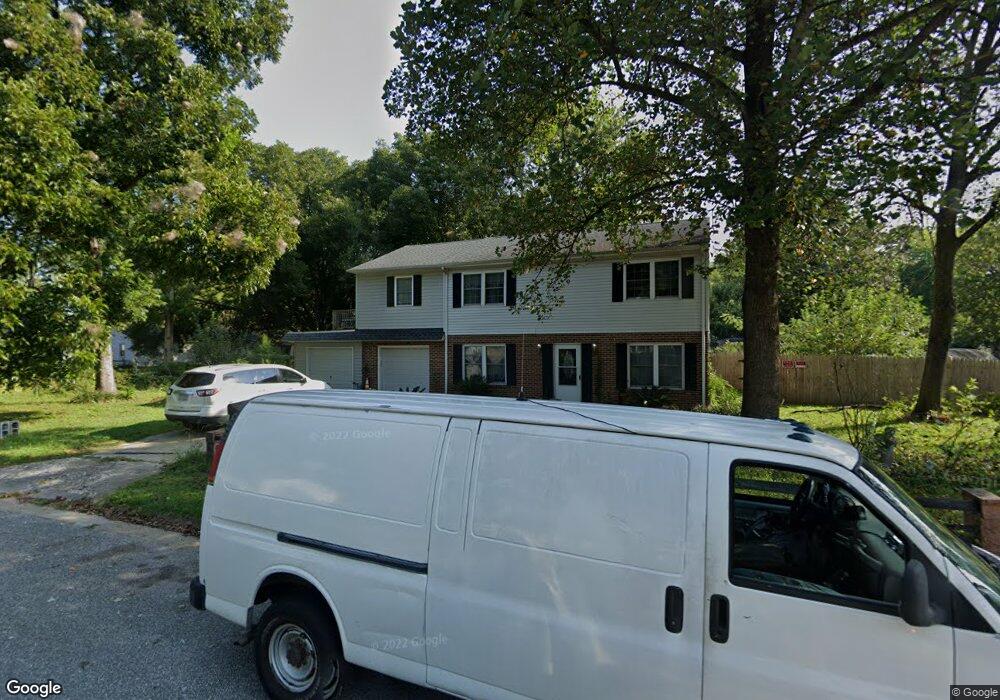
354 Malden Ln Newport News, VA 23602
Charles NeighborhoodEstimated Value: $347,000 - $367,000
5
Beds
3
Baths
1,927
Sq Ft
$186/Sq Ft
Est. Value
About This Home
This home is located at 354 Malden Ln, Newport News, VA 23602 and is currently estimated at $359,274, approximately $186 per square foot. 354 Malden Ln is a home located in Newport News City with nearby schools including B.C. Charles Elementary School, Ethel M. Gildersleeve Middle School, and Menchville High School.
Ownership History
Date
Name
Owned For
Owner Type
Purchase Details
Closed on
Mar 6, 2024
Sold by
Mendrugo Ip Llc
Bought by
Tutza Matthew A and Tutza Chelsea N
Current Estimated Value
Home Financials for this Owner
Home Financials are based on the most recent Mortgage that was taken out on this home.
Original Mortgage
$366,715
Outstanding Balance
$360,684
Interest Rate
6.69%
Mortgage Type
VA
Estimated Equity
-$1,410
Purchase Details
Closed on
Sep 27, 2023
Sold by
Pacini Patricia A
Bought by
Pacini Kevin R
Purchase Details
Closed on
Sep 20, 2023
Sold by
Pacini Kevin R
Bought by
Mendrugo Ip Llc
Purchase Details
Closed on
Feb 23, 2018
Sold by
Butts Lesley T
Bought by
Pacini Kevin R and Pacini Patricia A
Home Financials for this Owner
Home Financials are based on the most recent Mortgage that was taken out on this home.
Original Mortgage
$237,590
Interest Rate
4.15%
Mortgage Type
VA
Create a Home Valuation Report for This Property
The Home Valuation Report is an in-depth analysis detailing your home's value as well as a comparison with similar homes in the area
Home Values in the Area
Average Home Value in this Area
Purchase History
| Date | Buyer | Sale Price | Title Company |
|---|---|---|---|
| Tutza Matthew A | $355,000 | Fidelity National Title Insura | |
| Pacini Kevin R | -- | None Listed On Document | |
| Mendrugo Ip Llc | $229,444 | None Listed On Document | |
| Pacini Kevin R | $230,000 | Attorney |
Source: Public Records
Mortgage History
| Date | Status | Borrower | Loan Amount |
|---|---|---|---|
| Open | Tutza Matthew A | $366,715 | |
| Previous Owner | Pacini Kevin R | $237,590 |
Source: Public Records
Tax History Compared to Growth
Tax History
| Year | Tax Paid | Tax Assessment Tax Assessment Total Assessment is a certain percentage of the fair market value that is determined by local assessors to be the total taxable value of land and additions on the property. | Land | Improvement |
|---|---|---|---|---|
| 2024 | $3,790 | $321,200 | $66,000 | $255,200 |
| 2023 | $3,771 | $309,000 | $66,000 | $243,000 |
| 2022 | $3,527 | $281,700 | $66,000 | $215,700 |
| 2021 | $2,960 | $242,600 | $60,000 | $182,600 |
| 2020 | $2,920 | $227,300 | $60,000 | $167,300 |
| 2019 | $2,799 | $217,800 | $60,000 | $157,800 |
| 2018 | $2,796 | $217,800 | $60,000 | $157,800 |
| 2017 | $2,563 | $198,700 | $60,000 | $138,700 |
| 2016 | $2,559 | $198,700 | $60,000 | $138,700 |
| 2015 | $2,553 | $198,700 | $60,000 | $138,700 |
| 2014 | $2,248 | $198,700 | $60,000 | $138,700 |
Source: Public Records
Map
Nearby Homes
- 239 Yoder Ln
- 300 Colony Rd
- 461 Dunmore Dr
- 179 Bret Harte Dr
- 474 Dunmore Dr
- 114 Linbrook Dr
- 140 Lowell Place
- 109 Fischer Dr
- 178 Colony Rd
- 203 Tabbs Ln
- 411 Eastwood Dr
- 6 Gwynn Cir
- 525 Helm Dr
- 119 Menchville Rd
- 151 Princess Margaret Dr
- 9 Lakeview Dr
- 432 Eastwood Dr
- 165 Little John Place
- 436 Eastwood Dr
- 157 Robinhood Ln