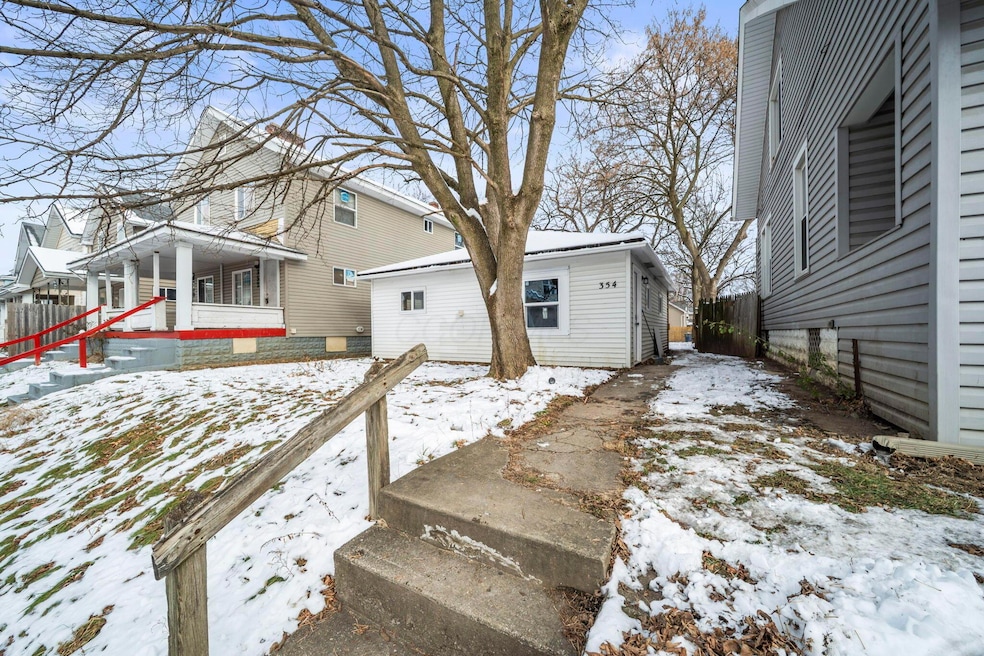
354 S Harris Ave Columbus, OH 43204
Central Hilltop NeighborhoodEstimated payment $972/month
Highlights
- Ranch Style House
- Forced Air Heating and Cooling System
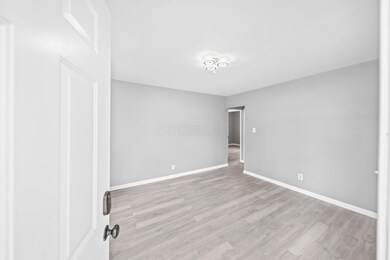
- Vinyl Flooring
- No HOA
About This Home
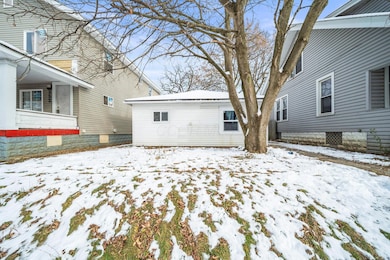
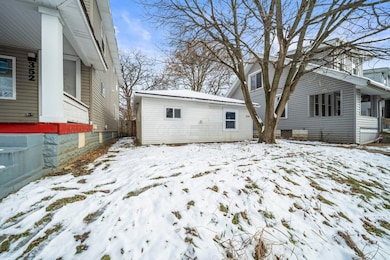
NEW ROOF AND LARGE BACKYARD !
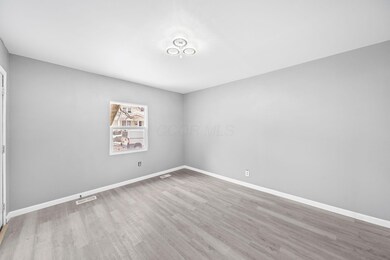
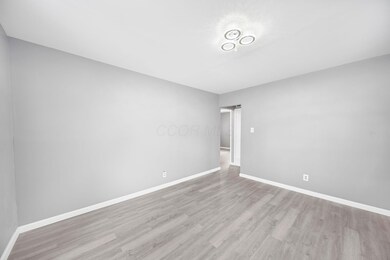
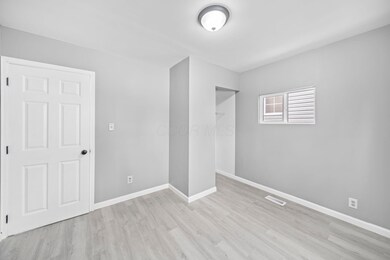
Welcome to 354 S Harris Ave — a beautifully remodeled home that feels brand new the moment you walk in! Every inch of this house has been updated, giving you modern style and peace of mind with a new roof and HVAC Step inside to an open, bright living space with fresh flooring, new paint, and a warm, welcoming feel. The kitchen has been totally revamped with new cabinets, countertops, and fixtures — the perfect spot for everyday cooking or hosting friends. The bathroom shines with stylish updates and all-new finishes. Both bedrooms are comfortable with great natural light, making the home feel cozy yet spacious. Outside, you'll find a clean, low-maintenance yard with room to enjoy or personalize to your liking. Whether you're a first-time homebuyer looking for a clean, affordable, turnkey home — or an investor looking for a cash-flow-ready rental — this property checks all the boxes.
Home Details
Home Type
- Single Family
Est. Annual Taxes
- $2,878
Year Built
- Built in 1955
Lot Details
- 4,356 Sq Ft Lot
Home Design
- Ranch Style House
- Block Foundation
- Vinyl Siding
Interior Spaces
- 672 Sq Ft Home
- Vinyl Flooring
Bedrooms and Bathrooms
- 2 Main Level Bedrooms
- 1 Full Bathroom
Laundry
- Laundry on main level
- Gas Dryer Hookup
Parking
- No Garage
- On-Street Parking
- Off-Street Parking: 1
Utilities
- Forced Air Heating and Cooling System
- Heating System Uses Gas
- Well
- Gas Water Heater
Community Details
- No Home Owners Association
Listing and Financial Details
- Assessor Parcel Number 010-045469
Map
Home Values in the Area
Average Home Value in this Area
Tax History
| Year | Tax Paid | Tax Assessment Tax Assessment Total Assessment is a certain percentage of the fair market value that is determined by local assessors to be the total taxable value of land and additions on the property. | Land | Improvement |
|---|---|---|---|---|
| 2024 | $8,033 | $18,760 | $5,670 | $13,090 |
| 2023 | $2,518 | $18,760 | $5,670 | $13,090 |
| 2022 | $5,169 | $10,360 | $1,820 | $8,540 |
| 2021 | $1,684 | $10,360 | $1,820 | $8,540 |
| 2020 | $1,635 | $10,360 | $1,820 | $8,540 |
| 2019 | $1,415 | $8,580 | $1,510 | $7,070 |
| 2018 | $680 | $8,580 | $1,510 | $7,070 |
| 2017 | $1,460 | $8,580 | $1,510 | $7,070 |
| 2016 | $1,499 | $9,880 | $4,030 | $5,850 |
| 2015 | $368 | $4,210 | $4,030 | $180 |
| 2014 | $439 | $7,080 | $4,030 | $3,050 |
| 2013 | $362 | $11,830 | $4,725 | $7,105 |
Property History
| Date | Event | Price | List to Sale | Price per Sq Ft |
|---|---|---|---|---|
| 12/07/2025 12/07/25 | For Sale | $139,500 | -- | $208 / Sq Ft |
Purchase History
| Date | Type | Sale Price | Title Company |
|---|---|---|---|
| Fiduciary Deed | $43,200 | Talon Title | |
| Quit Claim Deed | $1,500 | None Available | |
| Executors Deed | $51,000 | Chicago Title | |
| Interfamily Deed Transfer | -- | -- | |
| Deed | $26,000 | -- | |
| Deed | -- | -- |
Mortgage History
| Date | Status | Loan Amount | Loan Type |
|---|---|---|---|
| Previous Owner | $40,800 | Purchase Money Mortgage | |
| Closed | $0 | No Value Available |
Source: Columbus and Central Ohio Regional MLS
MLS Number: 225044956
APN: 010-045469
Disclaimer: Certain information contained herein is derived from information provided by parties other than Homes.com. All information provided is deemed reliable, but is not guaranteed to be accurate and should be independently verified.
![]() IDX information is provided exclusively for personal, non-commercial use, and may not be used for any purpose other than to identify prospective properties consumers may be interested in purchasing.
IDX information is provided exclusively for personal, non-commercial use, and may not be used for any purpose other than to identify prospective properties consumers may be interested in purchasing.
Information is deemed reliable but not guaranteed.
- 361 S Harris Ave Unit 361
- 389 S Harris Ave
- 334 S Warren Ave
- 365 S Ogden Ave
- 406 S Hague Ave Unit 6
- 418 S Warren Ave
- 350 S Ogden Ave
- 310 S Ogden Ave
- 262 S Harris Ave
- 444 S Warren Ave
- 423 S Hague Ave
- 448 S Warren Ave
- 405 S Burgess Ave
- 397 S Burgess Ave
- 235 S Harris Ave
- 438 S Powell Ave
- 2845 Fremont St
- 227 S Hague Ave
- 219 S Ogden Ave
- 500 S Warren Ave
- 299 S Warren Ave
- 341 S Roys Ave
- 534 S Richardson Ave
- 2895 Sullivant Ave
- 367 S Wayne Ave
- 372-374-374 S Huron Ave Unit 372
- 372-374-374 S Huron Ave Unit 374
- 448 S Huron Ave
- 40 S Richardson Ave
- 610 Salisbury Rd
- 432 S Highland Ave
- 821 S Harris Ave
- 2275 Union Ave
- 671-673-673 S Wheatland Ave Unit 671 S Wheatland
- 185 N Harris Ave
- 73 N Oakley Ave
- 195 S Sylvan Ave
- 3295 Sullivant Ave Unit N
- 384 Whitethorne Ave
- 949 S Harris Ave
