Estimated Value: $496,000 - $580,492
5
Beds
3
Baths
3,288
Sq Ft
$165/Sq Ft
Est. Value
About This Home
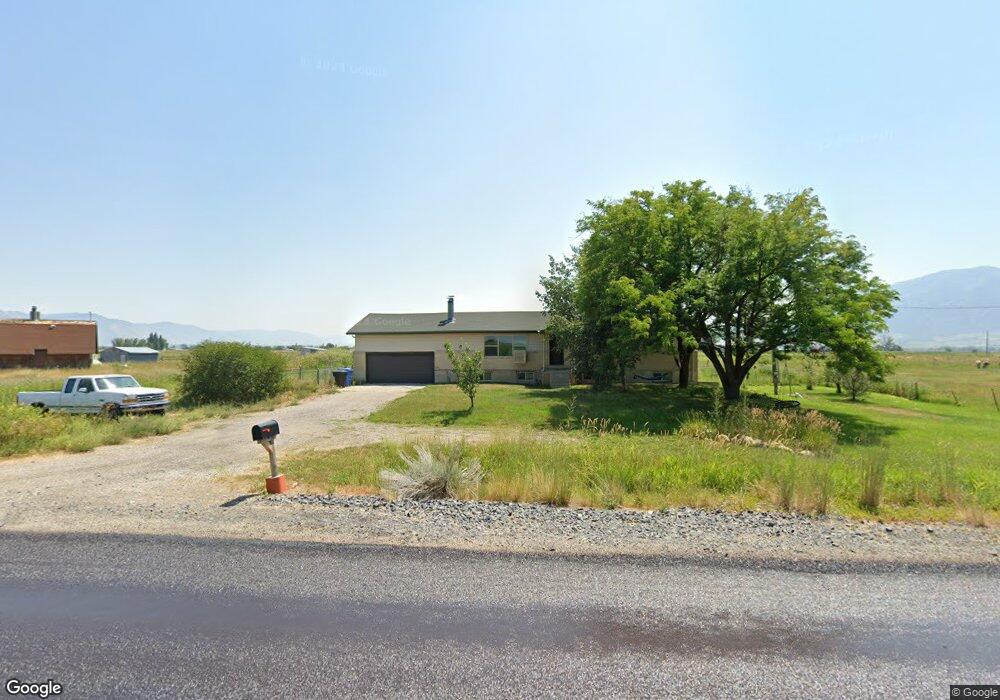
This home is located at 3540 W 600 S, Logan, UT 84321 and is currently estimated at $541,873, approximately $164 per square foot. 3540 W 600 S is a home located in Cache County with nearby schools including Mountainside School, South Cache Middle School, and Mountain Crest High School.
Ownership History
Date
Name
Owned For
Owner Type
Purchase Details
Closed on
Dec 13, 2006
Sold by
Brown Robert M and Brown Joleen S
Bought by
Mcnees Michael L and Mcnees Tani T
Current Estimated Value
Home Financials for this Owner
Home Financials are based on the most recent Mortgage that was taken out on this home.
Original Mortgage
$159,900
Outstanding Balance
$95,166
Interest Rate
6.32%
Mortgage Type
New Conventional
Estimated Equity
$446,707
Purchase Details
Closed on
Dec 29, 2000
Sold by
Wangsgard Michael R and Wangsgard Beth R
Bought by
Brown Robert M and Brown Joleen S
Home Financials for this Owner
Home Financials are based on the most recent Mortgage that was taken out on this home.
Original Mortgage
$125,000
Interest Rate
7.65%
Mortgage Type
Seller Take Back
Create a Home Valuation Report for This Property
The Home Valuation Report is an in-depth analysis detailing your home's value as well as a comparison with similar homes in the area
Home Values in the Area
Average Home Value in this Area
Purchase History
| Date | Buyer | Sale Price | Title Company |
|---|---|---|---|
| Mcnees Michael L | -- | Hickman Land Title Company | |
| Brown Robert M | -- | Hickman Land Title Company |
Source: Public Records
Mortgage History
| Date | Status | Borrower | Loan Amount |
|---|---|---|---|
| Open | Mcnees Michael L | $159,900 | |
| Previous Owner | Brown Robert M | $125,000 |
Source: Public Records
Tax History
| Year | Tax Paid | Tax Assessment Tax Assessment Total Assessment is a certain percentage of the fair market value that is determined by local assessors to be the total taxable value of land and additions on the property. | Land | Improvement |
|---|---|---|---|---|
| 2025 | $1,926 | $310,240 | $0 | $0 |
| 2024 | $2,082 | $310,240 | $0 | $0 |
| 2023 | $221 | $308,275 | $0 | $0 |
| 2022 | $2,311 | $308,280 | $0 | $0 |
| 2021 | $1,861 | $371,260 | $79,900 | $291,360 |
| 2020 | $1,717 | $323,200 | $79,900 | $243,300 |
| 2019 | $1,664 | $295,281 | $79,900 | $215,381 |
| 2018 | $1,531 | $262,884 | $79,900 | $182,984 |
| 2017 | $1,462 | $137,535 | $0 | $0 |
| 2016 | $1,484 | $112,285 | $0 | $0 |
| 2015 | $1,209 | $112,285 | $0 | $0 |
| 2014 | $1,173 | $112,285 | $0 | $0 |
| 2013 | -- | $112,285 | $0 | $0 |
Source: Public Records
Map
Nearby Homes
- 3703 W 600 S
- 5800 W 1800 S
- 6044 W 1800 S
- 1788 W Rivergate Dr
- 1772 W Rivergate Dr
- 679 Trail Cir
- Redwood Plan at Rivergate - Logan
- Madison Plan at Rivergate - Logan
- Sitka Plan at Sugar Creek - Logan (Townhomes)
- Auburn Plan at Rivergate - Logan
- Hilldale Plan at Rivergate - Logan
- 1615 W Silver Canoe Way
- 1609 W Silver Canoe Way
- 1603 W Silver Canoe Way
- 539 S 1580 W Unit 121
- 2157 S 1580 W
- 552 S W Rivergate Dr
- 524 S W Rivergate Dr
- 552 Rivergate Dr
- 1585 W Silver Canoe Way
Your Personal Tour Guide
Ask me questions while you tour the home.