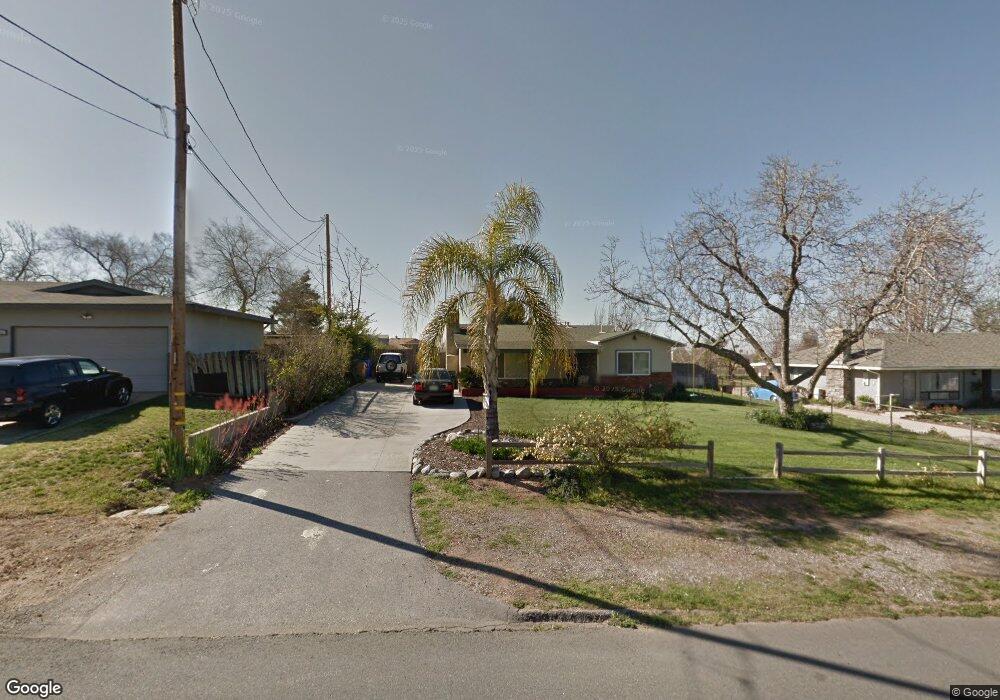
35409 Fir Ave Yucaipa, CA 92399
Upper Yucaipa-Rolling Hills NeighborhoodEstimated Value: $325,000 - $709,000
2
Beds
1
Bath
1,023
Sq Ft
$505/Sq Ft
Est. Value
About This Home
This home is located at 35409 Fir Ave, Yucaipa, CA 92399 and is currently estimated at $516,417, approximately $504 per square foot. 35409 Fir Ave is a home located in San Bernardino County with nearby schools including Ridgeview Elementary School, Park View Middle School, and Yucaipa High School.
Ownership History
Date
Name
Owned For
Owner Type
Purchase Details
Closed on
Nov 5, 2002
Sold by
Smith Timothy J
Bought by
Smith Timothy J and Smith Michelle S
Current Estimated Value
Purchase Details
Closed on
Jul 5, 2002
Sold by
Smith Sean M
Bought by
Smith Timothy J and Smith Michelle S
Home Financials for this Owner
Home Financials are based on the most recent Mortgage that was taken out on this home.
Original Mortgage
$110,000
Outstanding Balance
$46,002
Interest Rate
6.52%
Estimated Equity
$470,415
Purchase Details
Closed on
Jun 14, 1999
Sold by
Hobbs Pamela A
Bought by
Smith Sean M and Smith Cammie L
Home Financials for this Owner
Home Financials are based on the most recent Mortgage that was taken out on this home.
Original Mortgage
$107,613
Interest Rate
7.64%
Mortgage Type
FHA
Purchase Details
Closed on
Mar 10, 1997
Sold by
Hobbs Pamela A
Bought by
Hobbs Pamela A
Home Financials for this Owner
Home Financials are based on the most recent Mortgage that was taken out on this home.
Original Mortgage
$58,100
Interest Rate
7.63%
Purchase Details
Closed on
Nov 11, 1995
Sold by
Hobbs Pamela A
Bought by
Hobbs Pamela A
Purchase Details
Closed on
Sep 29, 1995
Sold by
Gilden Mary Ellen
Bought by
Gilden Mary Ellen and Mary Ellen Gilden Living Trust
Create a Home Valuation Report for This Property
The Home Valuation Report is an in-depth analysis detailing your home's value as well as a comparison with similar homes in the area
Home Values in the Area
Average Home Value in this Area
Purchase History
| Date | Buyer | Sale Price | Title Company |
|---|---|---|---|
| Smith Timothy J | -- | -- | |
| Smith Timothy J | $140,000 | Commonwealth Land Title Co | |
| Smith Sean M | $108,500 | Fidelity National Title Ins | |
| Hobbs Pamela A | -- | First American Title Ins Co | |
| Hobbs Pamela A | -- | -- | |
| Gilden Mary Ellen | -- | -- |
Source: Public Records
Mortgage History
| Date | Status | Borrower | Loan Amount |
|---|---|---|---|
| Open | Smith Timothy J | $110,000 | |
| Previous Owner | Smith Sean M | $107,613 | |
| Previous Owner | Hobbs Pamela A | $58,100 |
Source: Public Records
Tax History Compared to Growth
Tax History
| Year | Tax Paid | Tax Assessment Tax Assessment Total Assessment is a certain percentage of the fair market value that is determined by local assessors to be the total taxable value of land and additions on the property. | Land | Improvement |
|---|---|---|---|---|
| 2025 | $2,845 | $202,765 | $53,589 | $149,176 |
| 2024 | $2,845 | $198,789 | $52,538 | $146,251 |
| 2023 | $2,744 | $194,891 | $51,508 | $143,383 |
| 2022 | $2,696 | $191,070 | $50,498 | $140,572 |
| 2021 | $2,644 | $187,324 | $49,508 | $137,816 |
| 2020 | $2,571 | $185,403 | $49,000 | $136,403 |
| 2019 | $2,486 | $181,767 | $48,039 | $133,728 |
| 2018 | $2,101 | $178,203 | $47,097 | $131,106 |
| 2017 | $2,054 | $174,709 | $46,174 | $128,535 |
| 2016 | $2,025 | $171,284 | $45,269 | $126,015 |
| 2015 | $2,003 | $168,711 | $44,589 | $124,122 |
| 2014 | $1,962 | $165,407 | $43,716 | $121,691 |
Source: Public Records
Map
Nearby Homes
- 35420 Shade Tree Rd
- 35488 Schafer Ranch Rd
- 35218 Fir Ave Unit 15
- 35218 Fir Ave Unit 200
- 35425 Fir Ave
- 35493 Balsa St
- 35246 Silver Leaf Cir
- 10675 Bryant St Unit 109
- 11050 Bryant St Unit 78
- 11050 Bryant St Unit 36
- 35164 Willow Springs Dr
- 10622 Bryant St Unit 54
- 10622 Bryant St Unit 77
- 35110 Willow Springs Dr
- 10776 Sunnyside Dr
- 11425 Bryant St
- 10927 Deer Valley Rd
- 35602 Carter St
- 35892 Oak Glen Rd
- 34900 N Serrano Square
- 35419 Fir Ave
- 35399 Fir Ave
- 35417 Fir Ave
- 35375 Fir Ave
- 35380 Dry Creek Rd
- 35427 Fir Ave
- 35421 Fir Ave
- 35360 Dry Creek Rd
- 35410 Fir Ave
- 35398 Fir Ave
- 35367 Fir Ave
- 35388 Fir Ave
- 35457 Fir Ave
- 35357 Fir Ave
- 35348 Dry Creek Rd
- 10870 Lennox St
- 35390 Dry Creek Rd
- 10956 Yunis Ct
- 35377 Dry Creek Rd
- 35448 Fir Ave