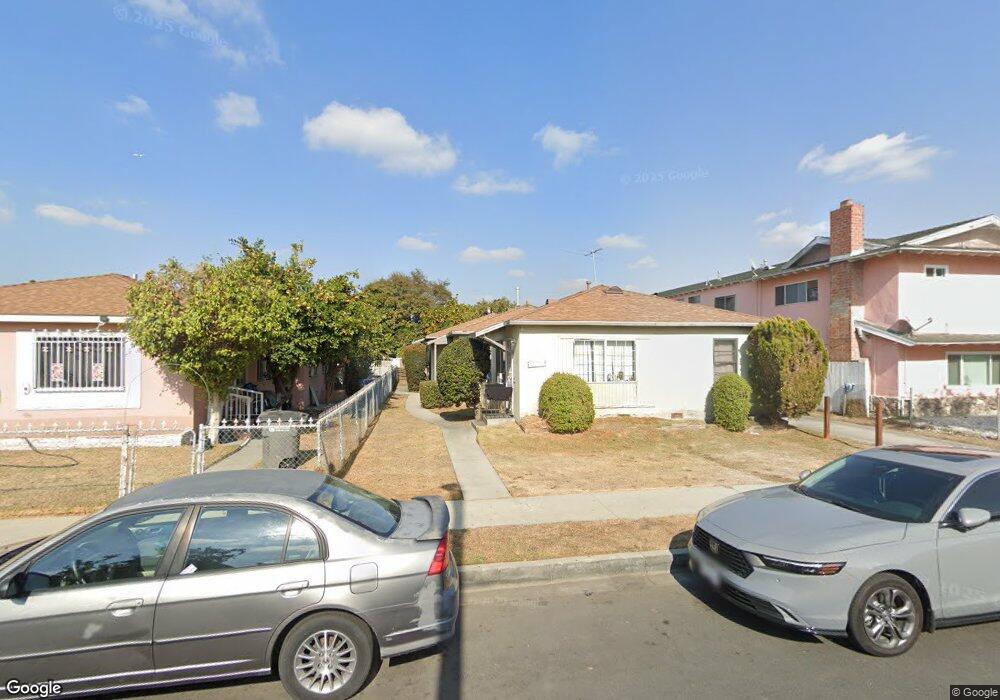
3541 Los Flores Blvd Lynwood, CA 90262
Estimated Value: $521,000 - $845,000
4
Beds
3
Baths
2,010
Sq Ft
$358/Sq Ft
Est. Value
About This Home
This home is located at 3541 Los Flores Blvd, Lynwood, CA 90262 and is currently estimated at $719,667, approximately $358 per square foot. 3541 Los Flores Blvd is a home located in Los Angeles County with nearby schools including Thurgood Marshall Elementary School, Cesar Chavez Middle School, and Lynwood High School.
Ownership History
Date
Name
Owned For
Owner Type
Purchase Details
Closed on
Jul 21, 2015
Sold by
Martinez Migdalia Munoz
Bought by
Martinez Joaquin and Martinez Migdalia Munoz
Current Estimated Value
Home Financials for this Owner
Home Financials are based on the most recent Mortgage that was taken out on this home.
Original Mortgage
$255,000
Outstanding Balance
$199,664
Interest Rate
3.98%
Mortgage Type
New Conventional
Estimated Equity
$520,003
Purchase Details
Closed on
Jun 28, 2007
Sold by
Munoz Ruben
Bought by
Munoz Migdalia
Purchase Details
Closed on
Apr 22, 2005
Sold by
Munoz Maria A
Bought by
Munoz Ruben
Home Financials for this Owner
Home Financials are based on the most recent Mortgage that was taken out on this home.
Original Mortgage
$208,000
Interest Rate
5.92%
Mortgage Type
New Conventional
Purchase Details
Closed on
Aug 20, 1998
Sold by
Delatorre Salvador
Bought by
Munoz Ruben
Create a Home Valuation Report for This Property
The Home Valuation Report is an in-depth analysis detailing your home's value as well as a comparison with similar homes in the area
Home Values in the Area
Average Home Value in this Area
Purchase History
| Date | Buyer | Sale Price | Title Company |
|---|---|---|---|
| Martinez Joaquin | -- | Fidelity National Title Co | |
| Munoz Migdalia | -- | None Available | |
| Munoz Ruben | -- | Fidelity National Title Co | |
| Munoz Ruben | -- | -- |
Source: Public Records
Mortgage History
| Date | Status | Borrower | Loan Amount |
|---|---|---|---|
| Open | Martinez Joaquin | $255,000 | |
| Previous Owner | Munoz Ruben | $208,000 |
Source: Public Records
Tax History Compared to Growth
Tax History
| Year | Tax Paid | Tax Assessment Tax Assessment Total Assessment is a certain percentage of the fair market value that is determined by local assessors to be the total taxable value of land and additions on the property. | Land | Improvement |
|---|---|---|---|---|
| 2025 | $5,832 | $377,181 | $191,933 | $185,248 |
| 2024 | $5,832 | $369,786 | $188,170 | $181,616 |
| 2023 | $5,790 | $362,536 | $184,481 | $178,055 |
| 2022 | $5,593 | $355,428 | $180,864 | $174,564 |
| 2021 | $5,395 | $348,460 | $177,318 | $171,142 |
| 2019 | $5,511 | $338,126 | $172,059 | $166,067 |
| 2018 | $5,043 | $331,497 | $168,686 | $162,811 |
| 2016 | $4,704 | $318,627 | $162,137 | $156,490 |
| 2015 | $4,612 | $313,842 | $159,702 | $154,140 |
| 2014 | $4,522 | $307,695 | $156,574 | $151,121 |
Source: Public Records
Map
Nearby Homes
- 3382 Los Flores Blvd
- 3323 Los Flores Blvd
- 3364 Elizabeth Ave
- 10611 San Luis Ave
- 3171 Norton Ave
- 11460 Copeland St
- 11464 Copeland St
- 3644 Platt Ave
- 10406 San Carlos Ave
- 10348 California Ave
- 3220 Tecumseh Ave
- 10249 California Ave
- 3685 Fernwood Ave
- 2975 Fernwood Ave
- 10245 Virginia Ave
- 3831 Walnut Ave
- 3805 Lugo Ave
- 3358 Michigan Ave
- 10355 Long Beach Blvd
- 10891 Standard Ave
- 3539 Los Flores Blvd
- 3557 Los Flores Blvd
- 3531 Los Flores Blvd
- 3561 Los Flores Blvd
- 3550 Los Flores Blvd
- 3548 Norton Ave
- 3542 Norton Ave
- 3564 Norton Ave
- 3540 Los Flores Blvd
- 3527 Los Flores Blvd Unit B
- 3527 Los Flores Blvd
- 3569 Los Flores Blvd
- 3534 Norton Ave
- 3530 Norton Ave
- 3536 Los Flores Blvd
- 3523 Los Flores Blvd
- 3573 Los Flores Blvd
- 3562 Los Flores Blvd
- 3528 Los Flores Blvd
- 3576 Norton Ave