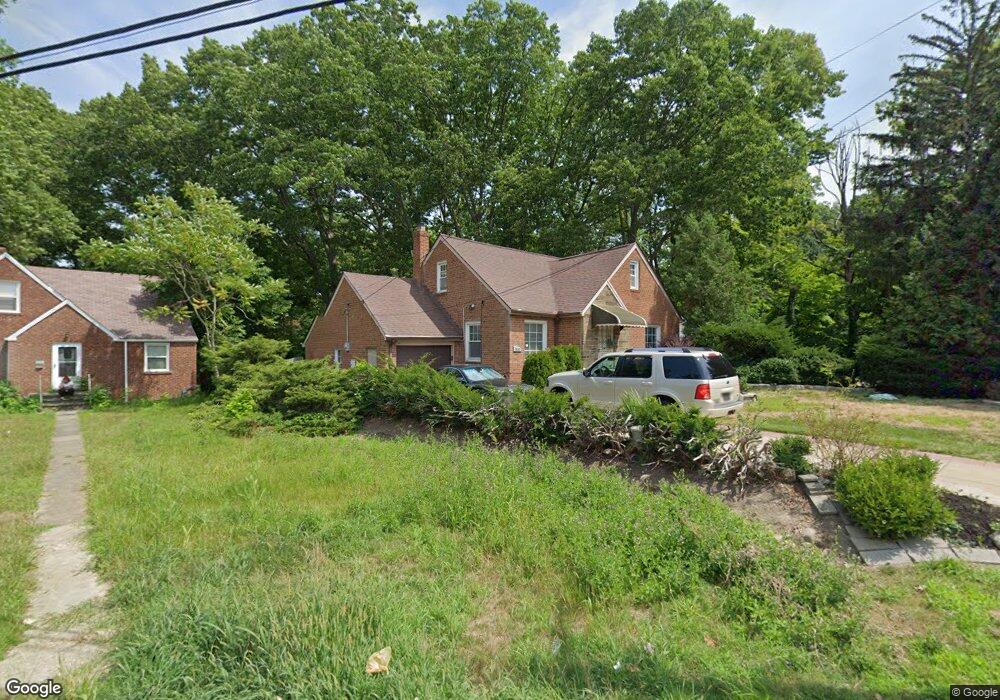
3541 Randolph Rd Cleveland, OH 44121
Monticello-Noble NeighborhoodEstimated Value: $88,000 - $236,000
2
Beds
1
Bath
853
Sq Ft
$171/Sq Ft
Est. Value
About This Home
This home is located at 3541 Randolph Rd, Cleveland, OH 44121 and is currently estimated at $145,978, approximately $171 per square foot. 3541 Randolph Rd is a home located in Cuyahoga County with nearby schools including Oxford Elementary School, Monticello Middle School, and Cleveland Heights High School.
Ownership History
Date
Name
Owned For
Owner Type
Purchase Details
Closed on
Jul 18, 1994
Sold by
Carr Jeannette M
Bought by
Boone Lottie D
Current Estimated Value
Home Financials for this Owner
Home Financials are based on the most recent Mortgage that was taken out on this home.
Original Mortgage
$74,182
Interest Rate
8.6%
Mortgage Type
FHA
Purchase Details
Closed on
Nov 24, 1993
Bought by
Carr Jeanette M
Purchase Details
Closed on
Jun 11, 1993
Sold by
Perkins Ann M
Bought by
Sec. Of H.U.D.
Purchase Details
Closed on
Dec 1, 1989
Sold by
Mcgonagle Beth Ann
Bought by
Perkins Ann M
Purchase Details
Closed on
Jan 29, 1985
Sold by
Anton George E
Bought by
Mcgonagle Beth Ann
Purchase Details
Closed on
Jun 20, 1978
Sold by
Kabel David W and Kabel Mary S
Bought by
Anton George E
Purchase Details
Closed on
Jan 1, 1975
Bought by
Kabel David W and Kabel Mary S
Create a Home Valuation Report for This Property
The Home Valuation Report is an in-depth analysis detailing your home's value as well as a comparison with similar homes in the area
Home Values in the Area
Average Home Value in this Area
Purchase History
| Date | Buyer | Sale Price | Title Company |
|---|---|---|---|
| Boone Lottie D | $74,000 | -- | |
| Carr Jeanette M | -- | -- | |
| Sec. Of H.U.D. | -- | -- | |
| Perkins Ann M | $58,000 | -- | |
| Mcgonagle Beth Ann | $49,000 | -- | |
| Anton George E | $34,000 | -- | |
| Kabel David W | -- | -- |
Source: Public Records
Mortgage History
| Date | Status | Borrower | Loan Amount |
|---|---|---|---|
| Previous Owner | Boone Lottie D | $74,182 |
Source: Public Records
Tax History Compared to Growth
Tax History
| Year | Tax Paid | Tax Assessment Tax Assessment Total Assessment is a certain percentage of the fair market value that is determined by local assessors to be the total taxable value of land and additions on the property. | Land | Improvement |
|---|---|---|---|---|
| 2024 | $3,892 | $44,730 | $15,890 | $28,840 |
| 2023 | $3,104 | $27,580 | $8,960 | $18,620 |
| 2022 | $3,089 | $27,580 | $8,960 | $18,620 |
| 2021 | $3,028 | $27,580 | $8,960 | $18,620 |
| 2020 | $3,019 | $24,850 | $8,090 | $16,770 |
| 2019 | $2,858 | $71,000 | $23,100 | $47,900 |
| 2018 | $2,795 | $24,850 | $8,090 | $16,770 |
| 2017 | $2,882 | $23,310 | $8,470 | $14,840 |
| 2016 | $2,876 | $23,310 | $8,470 | $14,840 |
| 2015 | $3,257 | $23,310 | $8,470 | $14,840 |
| 2014 | $3,257 | $28,080 | $10,190 | $17,890 |
Source: Public Records
Map
Nearby Homes
- 3511 Randolph Rd
- 3598 Atherstone Rd
- 3609 Langton Rd
- 888 Medford Rd
- 3655 Langton Rd
- 891 Medford Rd
- 901 Woodview Rd
- 915 Clarence Rd
- 772 Quilliams Rd
- 833 Nela View Rd
- 931 Yellowstone Rd
- 839 Nela View Rd
- 3679 Fenley Rd
- 896 Selwyn Rd
- 841 Helmsdale Rd
- 971 Rushleigh Rd
- 3759 Northampton Rd
- 3762 Covington Rd
- 990 Pembrook Rd
- 916 Whitby Rd
- 3533 Randolph Rd
- 3547 Randolph Rd
- 3529 Randolph Rd
- 3551 Randolph Rd
- 820 Lecona Rd
- 3555 Randolph Rd
- 3525 Randolph Rd
- 3542 Randolph Rd
- 3559 Randolph Rd
- 828 Lecona Rd
- 3546 Randolph Rd
- 3515 Randolph Rd
- 3563 Randolph Rd
- 3586 Atherstone Rd
- 3550 Randolph Rd
- 3574 Atherstone Rd
- 3592 Atherstone Rd
- 3567 Randolph Rd
- 831 Lecona Rd
- 832 Lecona Rd