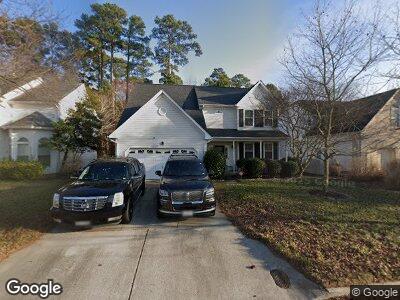
3541 Storm Bird Loop Virginia Beach, VA 23453
Green Run NeighborhoodEstimated Value: $489,585 - $522,000
4
Beds
3
Baths
2,728
Sq Ft
$186/Sq Ft
Est. Value
About This Home
This home is located at 3541 Storm Bird Loop, Virginia Beach, VA 23453 and is currently estimated at $506,646, approximately $185 per square foot. 3541 Storm Bird Loop is a home located in Virginia Beach City with nearby schools including Landstown Elementary School, Landstown Middle School, and Landstown High School.
Ownership History
Date
Name
Owned For
Owner Type
Purchase Details
Closed on
Dec 21, 2005
Sold by
Simmons Christopher
Bought by
Wright John
Current Estimated Value
Home Financials for this Owner
Home Financials are based on the most recent Mortgage that was taken out on this home.
Original Mortgage
$357,500
Interest Rate
6.16%
Mortgage Type
VA
Purchase Details
Closed on
Dec 1, 2003
Sold by
Leslie Lawrence
Bought by
Simmons Christopher
Home Financials for this Owner
Home Financials are based on the most recent Mortgage that was taken out on this home.
Original Mortgage
$192,000
Interest Rate
5.86%
Mortgage Type
New Conventional
Purchase Details
Closed on
Apr 30, 1999
Sold by
Mcq Bldrs And Dev
Bought by
Leslie Lawrence
Home Financials for this Owner
Home Financials are based on the most recent Mortgage that was taken out on this home.
Original Mortgage
$155,600
Interest Rate
6.95%
Create a Home Valuation Report for This Property
The Home Valuation Report is an in-depth analysis detailing your home's value as well as a comparison with similar homes in the area
Home Values in the Area
Average Home Value in this Area
Purchase History
| Date | Buyer | Sale Price | Title Company |
|---|---|---|---|
| Wright John | $350,000 | -- | |
| Simmons Christopher | $240,000 | -- | |
| Leslie Lawrence | $155,600 | -- |
Source: Public Records
Mortgage History
| Date | Status | Borrower | Loan Amount |
|---|---|---|---|
| Open | Wright John A | $85,000 | |
| Open | Wright Felici A | $318,800 | |
| Closed | Wright John A | $327,863 | |
| Closed | Wright John A | $377,414 | |
| Closed | Wright John A | $358,182 | |
| Previous Owner | Wright John | $357,500 | |
| Previous Owner | Simmons Christopher | $192,000 | |
| Previous Owner | Leslie Lawrence | $155,600 |
Source: Public Records
Tax History Compared to Growth
Tax History
| Year | Tax Paid | Tax Assessment Tax Assessment Total Assessment is a certain percentage of the fair market value that is determined by local assessors to be the total taxable value of land and additions on the property. | Land | Improvement |
|---|---|---|---|---|
| 2024 | $4,234 | $427,700 | $160,000 | $267,700 |
| 2023 | $4,255 | $429,800 | $153,600 | $276,200 |
| 2022 | $3,798 | $383,600 | $128,000 | $255,600 |
| 2021 | $3,355 | $338,900 | $115,000 | $223,900 |
| 2020 | $3,253 | $319,700 | $107,000 | $212,700 |
| 2019 | $3,170 | $308,200 | $107,000 | $201,200 |
| 2018 | $3,090 | $308,200 | $107,000 | $201,200 |
| 2017 | $2,970 | $296,300 | $103,000 | $193,300 |
| 2016 | $2,845 | $287,400 | $100,000 | $187,400 |
| 2015 | $2,767 | $279,500 | $96,000 | $183,500 |
| 2014 | $2,462 | $280,700 | $102,900 | $177,800 |
Source: Public Records
Map
Nearby Homes
- 3508 Criollo Dr
- 3612 Purebred Dr
- 3669 Purebred Dr
- 1520 Saddle Ct
- 3528 Light Horse Loop
- 1728 Eleni Ct
- 3445 Poppy Crescent
- 3416 Crimson Holly Ct
- 3400 Petunia Crescent
- 3309 Weeping Willow Ln
- 3512 Poppy Crescent
- 3321 Weeping Willow Ln
- 1248 Gladiola Crescent
- 1136 van Loen Dr
- 1132 van Loen Dr
- 3513 Brigita Ct
- 3518 Argo Ct
- 1521 Garland Way
- 3554 Brigita Ct
- 3703 Sylvan Ln
- 3541 Storm Bird Loop
- 3537 Storm Bird Loop
- 3545 Storm Bird Loop
- 3533 Storm Bird Loop
- 3549 Storm Bird Loop
- 3736 Storm Bird Loop
- 1512 Pony Ct
- 3529 Storm Bird Loop
- 3553 Storm Bird Loop
- 3732 Storm Bird Loop
- 3737 Storm Bird Loop
- 1508 Pony Ct
- 3525 Storm Bird Loop
- 3557 Storm Bird Loop
- 3733 Storm Bird Loop
- 3728 Storm Bird Loop
- 3524 Storm Bird Loop
- 3521 Storm Bird Loop
- 1504 Pony Ct
- 3561 Storm Bird Loop