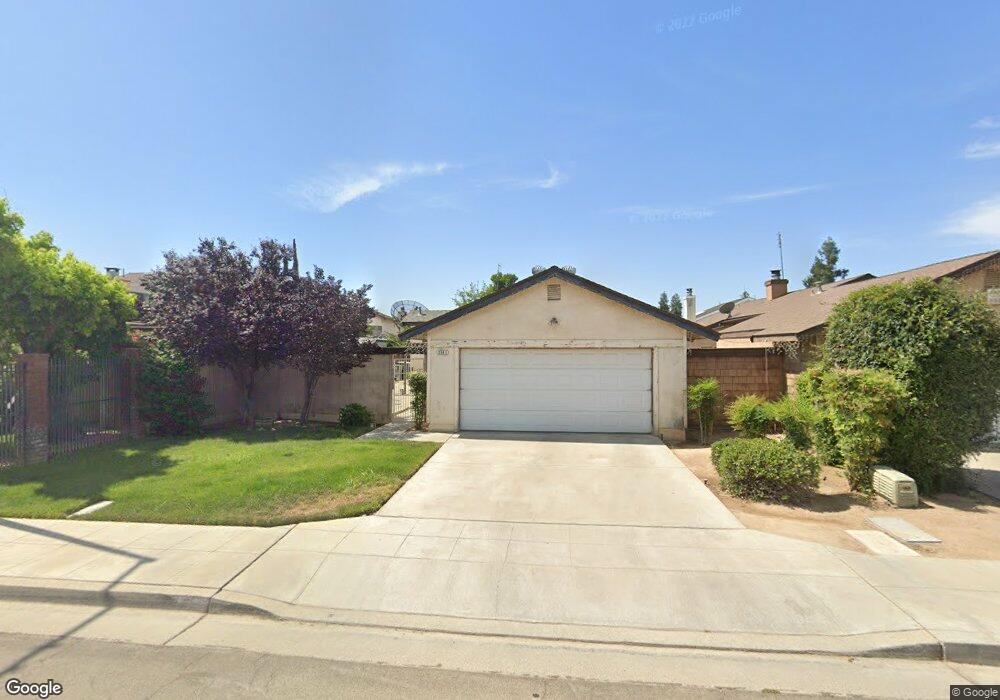
3541 W Simpson Ave Fresno, CA 93722
West Fresno NeighborhoodEstimated Value: $284,000 - $333,000
3
Beds
2
Baths
1,148
Sq Ft
$271/Sq Ft
Est. Value
About This Home
This home is located at 3541 W Simpson Ave, Fresno, CA 93722 and is currently estimated at $310,958, approximately $270 per square foot. 3541 W Simpson Ave is a home located in Fresno County with nearby schools including Hanh Phan Tilley Elementary, El Capitan Middle School, and Central East High School.
Ownership History
Date
Name
Owned For
Owner Type
Purchase Details
Closed on
Aug 14, 2024
Sold by
Lopez Rosa
Bought by
Rosa Lopez Living Trust and Lopez
Current Estimated Value
Purchase Details
Closed on
Oct 12, 2000
Sold by
Eric Strecker
Bought by
Lopez Rosa
Home Financials for this Owner
Home Financials are based on the most recent Mortgage that was taken out on this home.
Original Mortgage
$75,883
Interest Rate
7.9%
Mortgage Type
FHA
Purchase Details
Closed on
Jul 5, 1995
Sold by
Baker Mark B and Baker Marianne K
Bought by
Strecker Eric
Home Financials for this Owner
Home Financials are based on the most recent Mortgage that was taken out on this home.
Original Mortgage
$54,625
Interest Rate
7.63%
Purchase Details
Closed on
Nov 19, 1993
Sold by
Giesbrecht Mark Edward and Giesbrecht Kimberly Henderson
Bought by
Baker Mark B and Baker Marianne K
Home Financials for this Owner
Home Financials are based on the most recent Mortgage that was taken out on this home.
Original Mortgage
$69,885
Interest Rate
7.38%
Mortgage Type
FHA
Create a Home Valuation Report for This Property
The Home Valuation Report is an in-depth analysis detailing your home's value as well as a comparison with similar homes in the area
Home Values in the Area
Average Home Value in this Area
Purchase History
| Date | Buyer | Sale Price | Title Company |
|---|---|---|---|
| Rosa Lopez Living Trust | -- | None Listed On Document | |
| Lopez Rosa | $76,000 | Fidelity National Title Co | |
| Strecker Eric | $75,000 | Stewart Title | |
| Baker Mark B | $69,500 | Central Title Company |
Source: Public Records
Mortgage History
| Date | Status | Borrower | Loan Amount |
|---|---|---|---|
| Previous Owner | Lopez Rosa | $75,883 | |
| Previous Owner | Strecker Eric | $54,625 | |
| Previous Owner | Baker Mark B | $69,885 |
Source: Public Records
Tax History Compared to Growth
Tax History
| Year | Tax Paid | Tax Assessment Tax Assessment Total Assessment is a certain percentage of the fair market value that is determined by local assessors to be the total taxable value of land and additions on the property. | Land | Improvement |
|---|---|---|---|---|
| 2025 | $1,503 | $114,495 | $31,632 | $82,863 |
| 2023 | $1,468 | $110,051 | $30,404 | $79,647 |
| 2022 | $1,389 | $107,894 | $29,808 | $78,086 |
| 2021 | $1,399 | $105,779 | $29,224 | $76,555 |
| 2020 | $1,333 | $104,696 | $28,925 | $75,771 |
| 2019 | $1,313 | $102,644 | $28,358 | $74,286 |
| 2018 | $1,284 | $100,632 | $27,802 | $72,830 |
| 2017 | $1,289 | $98,659 | $27,257 | $71,402 |
| 2016 | $1,192 | $96,725 | $26,723 | $70,002 |
| 2015 | $1,187 | $95,273 | $26,322 | $68,951 |
| 2014 | $1,186 | $93,408 | $25,807 | $67,601 |
Source: Public Records
Map
Nearby Homes
- 2789 N Selland Ave
- 3425 W Forrest Dr
- 3374 W Shields Ave Unit 101-4
- 3472 W Cortland Ave Unit 97
- 3342 W Shields Ave
- 3546 W Harvard Ave
- 3656 W Harvard Ave
- 2691 N Brawley Ave
- 3537 W Fedora Ave
- 3630 W Terrace Ave
- 3670 W Terrace Ave
- 3612 W Garland Ave
- 3256 W Clinton Ave
- 2413 N Sonora Ave
- 4189 W Providence Ave
- 2387 N Hanover Ave
- 2260 N Hanover Ave
- 4200 W Dakota Ave
- 3138 W Dakota Ave Unit 210
- 3138 W Dakota Ave
- 3547 W Simpson Ave
- 2725 N Selland Ave
- 2719 N Selland Ave
- 3553 W Simpson Ave
- 2717 N Selland Ave
- 3546 W Cornell Ave
- 3540 W Cornell Ave
- 2740 N Dewey Ave
- 2711 N Selland Ave
- 3552 W Cornell Ave
- 3559 W Simpson Ave
- 2743 N Selland Ave
- 3558 W Cornell Ave
- 2705 N Selland Ave
- 2746 N Dewey Ave
- 2749 N Selland Ave
- 3565 W Simpson Ave
- 3564 W Cornell Ave
- 2699 N Selland Ave
- 2752 N Dewey Ave