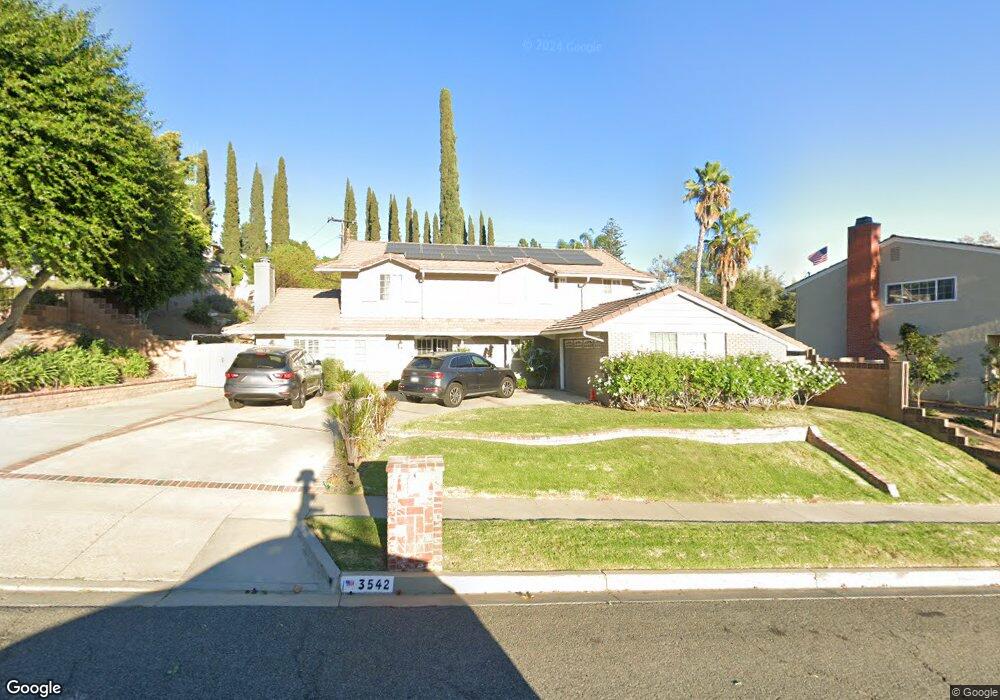
3542 Wellston Ct Simi Valley, CA 93063
Central Simi Valley NeighborhoodEstimated Value: $929,458 - $1,053,000
5
Beds
3
Baths
2,378
Sq Ft
$417/Sq Ft
Est. Value
About This Home
This home is located at 3542 Wellston Ct, Simi Valley, CA 93063 and is currently estimated at $992,115, approximately $417 per square foot. 3542 Wellston Ct is a home located in Ventura County with nearby schools including Township Elementary School, Valley View Middle School, and Simi Valley High School.
Ownership History
Date
Name
Owned For
Owner Type
Purchase Details
Closed on
Feb 5, 2004
Sold by
Cowan David R and Maroshek Jean Marie
Bought by
Maroshek Jean Marie
Current Estimated Value
Purchase Details
Closed on
Mar 18, 2003
Sold by
Maroshek Patrick J
Bought by
Maroshek Jean Marie
Home Financials for this Owner
Home Financials are based on the most recent Mortgage that was taken out on this home.
Original Mortgage
$312,500
Outstanding Balance
$140,404
Interest Rate
6.5%
Estimated Equity
$851,711
Purchase Details
Closed on
May 18, 1994
Sold by
Maroshek Jean Marie
Bought by
Maroshek Patrick J
Home Financials for this Owner
Home Financials are based on the most recent Mortgage that was taken out on this home.
Original Mortgage
$225,000
Interest Rate
8.52%
Purchase Details
Closed on
Apr 13, 1994
Sold by
Cooke Philip S and Cooke Laurel B
Bought by
Maroshek Patrick J
Home Financials for this Owner
Home Financials are based on the most recent Mortgage that was taken out on this home.
Original Mortgage
$225,000
Interest Rate
8.52%
Create a Home Valuation Report for This Property
The Home Valuation Report is an in-depth analysis detailing your home's value as well as a comparison with similar homes in the area
Home Values in the Area
Average Home Value in this Area
Purchase History
| Date | Buyer | Sale Price | Title Company |
|---|---|---|---|
| Maroshek Jean Marie | -- | Fidelity National Title | |
| Maroshek Jean Marie | -- | Fidelity National Title | |
| Maroshek Jean Marie | -- | American Title Co | |
| Maroshek Patrick J | -- | United Title Company | |
| Maroshek Patrick J | $250,000 | United Title Company |
Source: Public Records
Mortgage History
| Date | Status | Borrower | Loan Amount |
|---|---|---|---|
| Open | Maroshek Jean Marie | $312,500 | |
| Closed | Maroshek Patrick J | $225,000 |
Source: Public Records
Tax History Compared to Growth
Tax History
| Year | Tax Paid | Tax Assessment Tax Assessment Total Assessment is a certain percentage of the fair market value that is determined by local assessors to be the total taxable value of land and additions on the property. | Land | Improvement |
|---|---|---|---|---|
| 2025 | $5,428 | $429,835 | $171,933 | $257,902 |
| 2024 | $5,428 | $421,407 | $168,561 | $252,846 |
| 2023 | $5,104 | $413,145 | $165,256 | $247,889 |
| 2022 | $5,002 | $405,045 | $162,016 | $243,029 |
| 2021 | $4,959 | $397,103 | $158,839 | $238,264 |
| 2020 | $4,852 | $393,033 | $157,211 | $235,822 |
| 2019 | $4,630 | $385,328 | $154,129 | $231,199 |
| 2018 | $4,587 | $377,773 | $151,107 | $226,666 |
| 2017 | $4,558 | $370,367 | $148,145 | $222,222 |
| 2016 | $4,354 | $363,106 | $145,241 | $217,865 |
| 2015 | $4,260 | $357,654 | $143,060 | $214,594 |
| 2014 | $4,198 | $350,650 | $140,258 | $210,392 |
Source: Public Records
Map
Nearby Homes
- 0 Wells Ln Unit SR13190766
- 3524 Wellston Ct
- 4037 Presidio Dr
- 3574 Wellston Ct
- 3558 Wellston Ct
- 4045 Presidio Dr
- 3543 Wellston Ct
- 3525 Wellston Ct
- 3559 Wellston Ct
- 3590 Wellston Ct
- 3509 Wellston Ct
- 4061 Presidio Dr
- 4053 Presidio Dr
- 3591 Wellston Ct
- 3575 Wellston Ct
- 4036 Presidio Dr
- 4069 Presidio Dr
- 4028 Presidio Dr
- 4052 Presidio Dr
- 4000 Presidio Dr