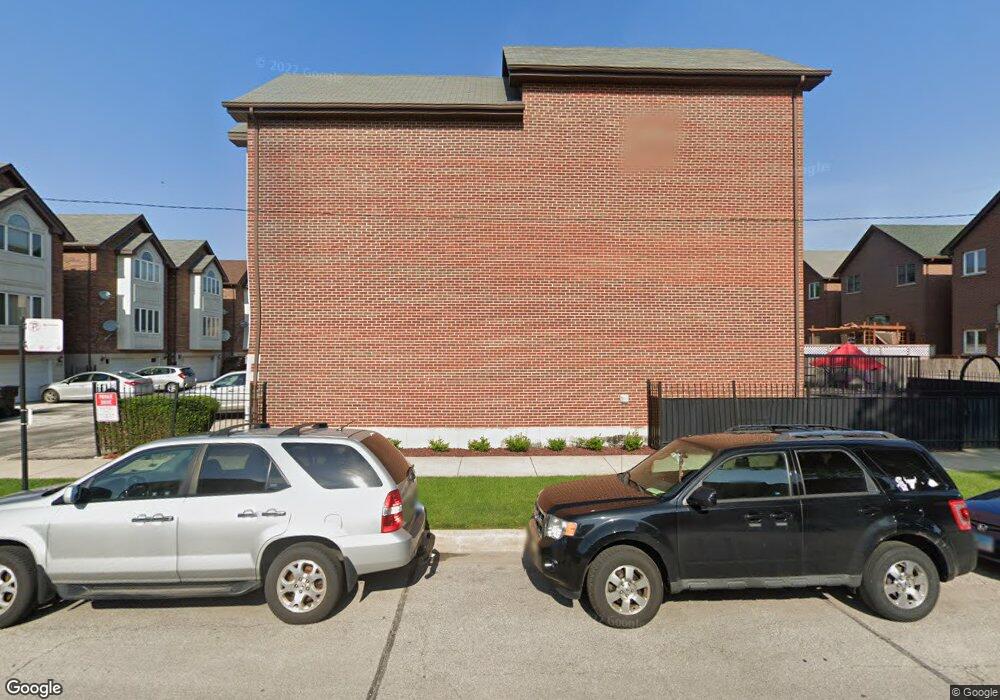
3543 S Parnell Ave Chicago, IL 60609
Bridgeport NeighborhoodEstimated Value: $616,000 - $810,000
3
Beds
2
Baths
2,823
Sq Ft
$251/Sq Ft
Est. Value
About This Home
This home is located at 3543 S Parnell Ave, Chicago, IL 60609 and is currently estimated at $708,105, approximately $250 per square foot. 3543 S Parnell Ave is a home located in Cook County with nearby schools including McClellan Elementary School, Bridgeport Catholic Academy - South Campus, and De La Salle Institute - Institute Campus.
Ownership History
Date
Name
Owned For
Owner Type
Purchase Details
Closed on
Nov 2, 2018
Sold by
V & T Investment Corp
Bought by
Xia Xu Shanzhong and Xia Xiao0 Cui
Current Estimated Value
Home Financials for this Owner
Home Financials are based on the most recent Mortgage that was taken out on this home.
Original Mortgage
$214,000
Outstanding Balance
$136,864
Interest Rate
5.25%
Mortgage Type
Future Advance Clause Open End Mortgage
Estimated Equity
$571,241
Purchase Details
Closed on
Dec 4, 2017
Sold by
Ramirez Ruben R
Bought by
V & T Investment Corp
Purchase Details
Closed on
May 20, 1999
Sold by
American National Bk & Tr Co Of Chicago
Bought by
Ramirez Ruben R and Ramirez Christine M
Home Financials for this Owner
Home Financials are based on the most recent Mortgage that was taken out on this home.
Original Mortgage
$221,300
Interest Rate
7.06%
Create a Home Valuation Report for This Property
The Home Valuation Report is an in-depth analysis detailing your home's value as well as a comparison with similar homes in the area
Home Values in the Area
Average Home Value in this Area
Purchase History
| Date | Buyer | Sale Price | Title Company |
|---|---|---|---|
| Xia Xu Shanzhong | $428,000 | First American Title | |
| V & T Investment Corp | $315,500 | None Available | |
| Ramirez Ruben R | $246,000 | -- |
Source: Public Records
Mortgage History
| Date | Status | Borrower | Loan Amount |
|---|---|---|---|
| Open | Xia Xu Shanzhong | $214,000 | |
| Previous Owner | Ramirez Ruben R | $221,300 |
Source: Public Records
Tax History Compared to Growth
Tax History
| Year | Tax Paid | Tax Assessment Tax Assessment Total Assessment is a certain percentage of the fair market value that is determined by local assessors to be the total taxable value of land and additions on the property. | Land | Improvement |
|---|---|---|---|---|
| 2024 | $9,850 | $63,000 | $12,551 | $50,449 |
| 2023 | $9,580 | $50,000 | $10,133 | $39,867 |
| 2022 | $9,580 | $50,000 | $10,133 | $39,867 |
| 2021 | $9,385 | $49,999 | $10,133 | $39,866 |
| 2020 | $11,087 | $52,872 | $10,133 | $42,739 |
| 2019 | $11,247 | $59,407 | $10,133 | $49,274 |
| 2018 | $11,735 | $59,407 | $10,133 | $49,274 |
| 2017 | $9,367 | $46,890 | $8,060 | $38,830 |
| 2016 | $8,891 | $46,890 | $8,060 | $38,830 |
| 2015 | $8,112 | $46,890 | $8,060 | $38,830 |
| 2014 | $7,461 | $42,779 | $6,909 | $35,870 |
| 2013 | $7,302 | $42,779 | $6,909 | $35,870 |
Source: Public Records
Map
Nearby Homes
- 3505 S Parnell Ave Unit D
- 3549 S Lowe Ave
- 3700 S Normal Ave
- 3640 S Lowe Ave
- 3600 S Union Ave
- 3727 S Lowe Ave
- 3405 S Union Ave
- 3416 S Union Ave
- 3322 S Parnell Ave
- 455 W 38th St
- 3315 S Lowe Ave
- 3357 S Emerald Ave
- 3600 S Halsted St
- 3246 S Normal Ave
- 3450 S Halsted St Unit 406
- 835 W 35th St
- 3214 S Canal St
- 3830 S Emerald Ave
- 3247 S Emerald Ave
- 3234 S Princeton Ave
- 3543 S Parnell Ave
- 3543 S Parnell Ave
- 3543 S Parnell Ave
- 3543 S Parnell Ave Unit B
- 512 W 36th St
- 3540 S Normal Ave
- 514 W 36th St
- 516 W 36th St
- 518 W 36th St
- 522 W 36th St
- 3541 S Parnell Ave
- 3541 S Parnell Ave
- 3541 S Parnell Ave
- 3541 S Parnell Ave
- 3541 S Parnell Ave
- 3527 S Parnell Ave Unit A
- 3527 S Parnell Ave Unit E
- 3527 S Parnell Ave Unit C
- 3527 S Parnell Ave Unit D
- 3527 S Parnell Ave Unit B