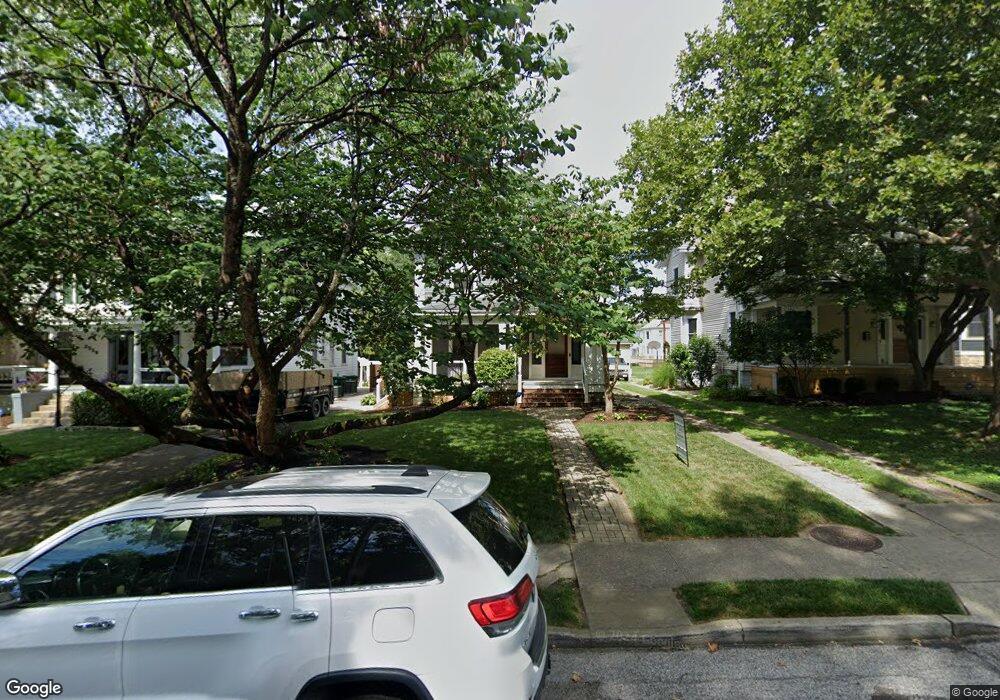
3543 Shaw Ave Cincinnati, OH 45208
Hyde Park NeighborhoodEstimated Value: $727,000 - $919,000
4
Beds
2
Baths
2,452
Sq Ft
$327/Sq Ft
Est. Value
About This Home
This home is located at 3543 Shaw Ave, Cincinnati, OH 45208 and is currently estimated at $802,787, approximately $327 per square foot. 3543 Shaw Ave is a home located in Hamilton County with nearby schools including Clark Montessori High School, Withrow University High School, and Shroder High School.
Ownership History
Date
Name
Owned For
Owner Type
Purchase Details
Closed on
Jan 27, 2006
Sold by
Berman Jason A and Berman Kathleen C
Bought by
Wenclewicz Jennifer
Current Estimated Value
Home Financials for this Owner
Home Financials are based on the most recent Mortgage that was taken out on this home.
Original Mortgage
$292,000
Outstanding Balance
$161,957
Interest Rate
6.34%
Mortgage Type
Fannie Mae Freddie Mac
Estimated Equity
$640,830
Purchase Details
Closed on
Nov 14, 2001
Sold by
Megan Richards and Megan Paula
Bought by
Berman Jason A and Berman Kathleen C
Home Financials for this Owner
Home Financials are based on the most recent Mortgage that was taken out on this home.
Original Mortgage
$244,000
Interest Rate
6.64%
Purchase Details
Closed on
Apr 24, 1998
Sold by
Fletcher Paula D
Bought by
Richards Megan and Fletcher Paula
Create a Home Valuation Report for This Property
The Home Valuation Report is an in-depth analysis detailing your home's value as well as a comparison with similar homes in the area
Home Values in the Area
Average Home Value in this Area
Purchase History
| Date | Buyer | Sale Price | Title Company |
|---|---|---|---|
| Wenclewicz Jennifer | -- | None Available | |
| Berman Jason A | $305,000 | Title Resolutions | |
| Richards Megan | -- | -- |
Source: Public Records
Mortgage History
| Date | Status | Borrower | Loan Amount |
|---|---|---|---|
| Open | Wenclewicz Jennifer | $292,000 | |
| Previous Owner | Berman Jason A | $244,000 |
Source: Public Records
Tax History
| Year | Tax Paid | Tax Assessment Tax Assessment Total Assessment is a certain percentage of the fair market value that is determined by local assessors to be the total taxable value of land and additions on the property. | Land | Improvement |
|---|---|---|---|---|
| 2025 | $12,114 | $196,823 | $100,429 | $96,394 |
| 2023 | $12,013 | $196,823 | $100,429 | $96,394 |
| 2022 | $11,083 | $162,915 | $73,343 | $89,572 |
| 2021 | $10,672 | $162,915 | $73,343 | $89,572 |
| 2020 | $10,983 | $162,915 | $73,343 | $89,572 |
| 2019 | $10,351 | $140,445 | $63,228 | $77,217 |
| 2018 | $10,367 | $140,445 | $63,228 | $77,217 |
| 2017 | $9,850 | $140,445 | $63,228 | $77,217 |
| 2016 | $9,068 | $127,404 | $54,418 | $72,986 |
| 2015 | $8,173 | $127,404 | $54,418 | $72,986 |
| 2014 | $8,231 | $127,404 | $54,418 | $72,986 |
| 2013 | $7,683 | $116,883 | $49,924 | $66,959 |
Source: Public Records
Map
Nearby Homes
- 2800 Erie Ave
- 3500 Michigan Ave
- 3506 Shaw Ave
- 3504 Shaw Ave
- 3414 Monteith Ave
- 3720 Michigan Ave
- 1318 Edwards Rd
- 3649 Besuden Ct
- 3658 Stettinius Ave
- 3725 Isabella Ave
- 3008 Erie Ave
- 2868 Pineridge Ave
- 3057 Portsmouth Ave
- 2517 Observatory Ave
- 3687 Kendall Ave
- 3847 Drake Ave
- 3764 Grovedale Place
- 3815 Eileen Dr
- 2922 Utopia Place
- 2802 Hyde Park Ave
- 3547 Shaw Ave
- 3539 Shaw Ave
- 3551 Shaw Ave
- 3535 Shaw Ave Unit 4
- 3535 Shaw Ave
- 3531 Shaw Ave
- 3555 Shaw Ave
- 3542 Michigan Ave
- 3529 Shaw Ave
- 3559 Shaw Ave
- 3538 Michigan Ave
- 3546 Michigan Ave
- 3534 Michigan Ave
- 3525 Shaw Ave
- 3525 Shaw Ave Unit 2
- 3525 Shaw Ave Unit Second & Third Floo
- 3530 Michigan Ave
- 3563 Shaw Ave
- 3554 Michigan Ave
- 3530 Shaw Ave