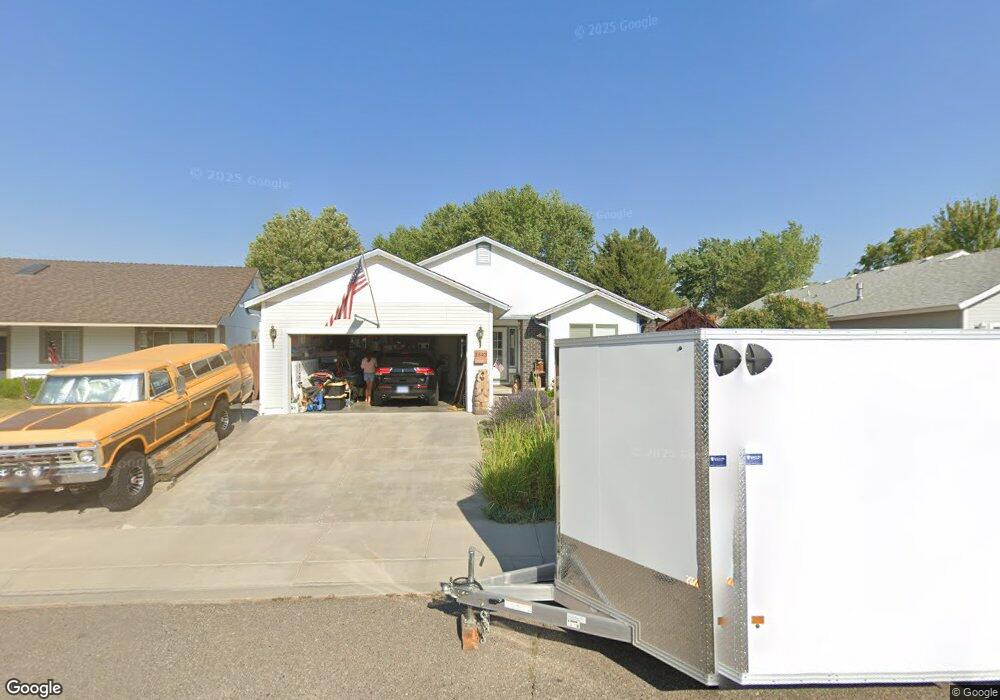
3543 Smoketree Ave Carson City, NV 89705
Estimated Value: $537,180 - $613,000
--
Bed
--
Bath
2,012
Sq Ft
$284/Sq Ft
Est. Value
About This Home
This home is located at 3543 Smoketree Ave, Carson City, NV 89705 and is currently estimated at $572,295, approximately $284 per square foot. 3543 Smoketree Ave is a home located in Douglas County with nearby schools including Jacks Valley Elementary School, Carson Valley Middle School, and Douglas County High School.
Ownership History
Date
Name
Owned For
Owner Type
Purchase Details
Closed on
Aug 26, 2015
Sold by
Rikalo Daniel M and Rikalo Kathryn A
Bought by
The Rikalo Living Trust and Rikalo Kathryn A
Current Estimated Value
Home Financials for this Owner
Home Financials are based on the most recent Mortgage that was taken out on this home.
Original Mortgage
$228,800
Outstanding Balance
$92,095
Interest Rate
4.05%
Mortgage Type
New Conventional
Estimated Equity
$480,200
Purchase Details
Closed on
Mar 8, 2010
Sold by
Rikalo Daniel M and Rikalo Kathryn A
Bought by
Rikalo Daniel M and Rikalo Kathryn A
Purchase Details
Closed on
Oct 27, 2009
Sold by
Salerno Charles A and Salerno Micah E
Bought by
Rikalo Daniel M and Rikalo Kathryn A
Home Financials for this Owner
Home Financials are based on the most recent Mortgage that was taken out on this home.
Original Mortgage
$249,246
Interest Rate
4.83%
Mortgage Type
New Conventional
Create a Home Valuation Report for This Property
The Home Valuation Report is an in-depth analysis detailing your home's value as well as a comparison with similar homes in the area
Home Values in the Area
Average Home Value in this Area
Purchase History
| Date | Buyer | Sale Price | Title Company |
|---|---|---|---|
| The Rikalo Living Trust | -- | First Centennial Reno | |
| Rikalo Daniel M | -- | First Centennial Reno | |
| Rikalo Daniel M | -- | None Available | |
| Rikalo Daniel M | $240,000 | First American Title Min |
Source: Public Records
Mortgage History
| Date | Status | Borrower | Loan Amount |
|---|---|---|---|
| Open | Rikalo Daniel M | $228,800 | |
| Closed | Rikalo Daniel M | $249,246 |
Source: Public Records
Tax History Compared to Growth
Tax History
| Year | Tax Paid | Tax Assessment Tax Assessment Total Assessment is a certain percentage of the fair market value that is determined by local assessors to be the total taxable value of land and additions on the property. | Land | Improvement |
|---|---|---|---|---|
| 2025 | $2,951 | $104,199 | $40,250 | $63,949 |
| 2024 | $2,865 | $104,783 | $40,250 | $64,533 |
| 2023 | $2,781 | $101,208 | $40,250 | $60,958 |
| 2022 | $2,781 | $96,270 | $38,500 | $57,770 |
| 2021 | $2,700 | $90,122 | $35,000 | $55,122 |
| 2020 | $2,622 | $87,799 | $33,250 | $54,549 |
| 2019 | $2,545 | $81,667 | $28,000 | $53,667 |
| 2018 | $2,471 | $76,287 | $24,500 | $51,787 |
| 2017 | $2,399 | $73,458 | $21,000 | $52,458 |
| 2016 | $2,338 | $66,519 | $14,000 | $52,519 |
| 2015 | $2,334 | $66,519 | $14,000 | $52,519 |
| 2014 | $2,266 | $63,594 | $14,000 | $49,594 |
Source: Public Records
Map
Nearby Homes
- 3549 Shadow Ln
- 997 Ridgeview Dr
- 3563 Loam Ln
- 3522 Smoketree Ave
- 982 Starleaf Ct
- 3532 Haystack Dr
- 990 Starleaf Ct
- 3560 Haystack Dr
- 967 Mica Dr
- 973 Sunview Dr
- 1030 Haystack Dr
- 1037 Sunburst Dr
- 984 Desert Dr
- 3492 Long Dr
- 3540 Tourmaline Ct
- 985 Hillside Dr
- 1310 Nebula Rd Unit Homesite 90
- 1322 Nebula Rd Unit Homesite 92
- 3610 Flare Ln Unit 3
- 3610 Flare Ln Unit 1
- 3541 Smoketree Ave
- 3545 Smoketree Ave
- 989 Sunnycrest Dr
- 3539 Smoketree Ave
- 3542 Smoketree
- 3542 Smoketree Ave
- 991 Sunnycrest Dr
- 3544 Smoketree Ave
- 982 Rolling Ridge Ct
- 3537 Smoketree Ave
- 3540 Smoketree Ave
- 988 Sunnycrest Dr
- 3548 Smoketree Ave
- 3549 Smoketree Ave
- 993 Sunnycrest Dr
- 980 Rolling Ridge Ct
- 984 Rolling Ridge Ct
- 990 Sunnycrest Dr
- 3535 Smoketree Ave
- 3550 Smoketree Ave