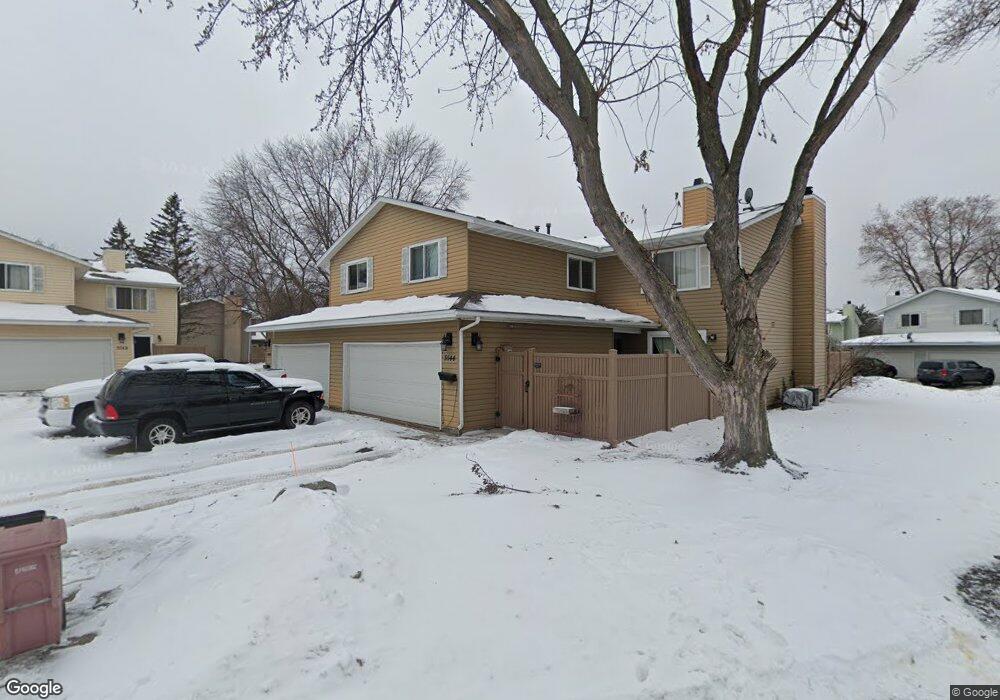
3544 Cloman Way Inver Grove Heights, MN 55076
Estimated Value: $218,000 - $234,000
2
Beds
1
Bath
1,256
Sq Ft
$181/Sq Ft
Est. Value
About This Home
This home is located at 3544 Cloman Way, Inver Grove Heights, MN 55076 and is currently estimated at $226,731, approximately $180 per square foot. 3544 Cloman Way is a home located in Dakota County with nearby schools including Hilltop Elementary School, Inver Grove Heights Middle School, and Simley Senior High School.
Ownership History
Date
Name
Owned For
Owner Type
Purchase Details
Closed on
Jan 31, 2019
Sold by
Suchy Ann and Harrision Ann Marie
Bought by
Harrison Jesse W
Current Estimated Value
Home Financials for this Owner
Home Financials are based on the most recent Mortgage that was taken out on this home.
Original Mortgage
$130,752
Outstanding Balance
$114,954
Interest Rate
4.5%
Mortgage Type
VA
Estimated Equity
$111,777
Purchase Details
Closed on
Aug 16, 2010
Sold by
Zanick Carolyn R
Bought by
Suchy Ann
Purchase Details
Closed on
Jul 22, 2002
Sold by
Lewandowski Kevin and Lewandowski Jennifer J
Bought by
Zanick Carolyn R
Purchase Details
Closed on
Jun 2, 1999
Sold by
Waldhauser Eleanor N and Waldhauser Donald G
Bought by
Crumb Jennifer J
Purchase Details
Closed on
Sep 28, 1998
Sold by
Beaudoin Douglas G
Bought by
Waldhauser Eleanor N and Waldhauser Donald G
Purchase Details
Closed on
Jul 25, 1996
Sold by
Hud
Bought by
Beaudoin Douglas G
Create a Home Valuation Report for This Property
The Home Valuation Report is an in-depth analysis detailing your home's value as well as a comparison with similar homes in the area
Home Values in the Area
Average Home Value in this Area
Purchase History
| Date | Buyer | Sale Price | Title Company |
|---|---|---|---|
| Harrison Jesse W | $128,000 | Titlesmart Inc | |
| Suchy Ann | $115,900 | None Available | |
| Zanick Carolyn R | $132,000 | -- | |
| Crumb Jennifer J | $89,500 | -- | |
| Waldhauser Eleanor N | $86,000 | -- | |
| Beaudoin Douglas G | $63,158 | -- |
Source: Public Records
Mortgage History
| Date | Status | Borrower | Loan Amount |
|---|---|---|---|
| Open | Harrison Jesse W | $130,752 |
Source: Public Records
Tax History Compared to Growth
Tax History
| Year | Tax Paid | Tax Assessment Tax Assessment Total Assessment is a certain percentage of the fair market value that is determined by local assessors to be the total taxable value of land and additions on the property. | Land | Improvement |
|---|---|---|---|---|
| 2024 | $1,944 | $203,500 | $29,700 | $173,800 |
| 2023 | $1,944 | $203,700 | $29,900 | $173,800 |
| 2022 | $1,778 | $201,900 | $29,800 | $172,100 |
| 2021 | $1,642 | $177,300 | $25,900 | $151,400 |
| 2020 | $1,522 | $163,500 | $24,700 | $138,800 |
| 2019 | $1,867 | $153,500 | $23,500 | $130,000 |
| 2018 | $1,353 | $141,800 | $21,800 | $120,000 |
| 2017 | $1,215 | $130,700 | $20,200 | $110,500 |
| 2016 | $1,113 | $119,300 | $19,200 | $100,100 |
| 2015 | $1,389 | $84,949 | $13,868 | $71,081 |
| 2014 | -- | $86,039 | $12,780 | $73,259 |
| 2013 | -- | $77,319 | $11,403 | $65,916 |
Source: Public Records
Map
Nearby Homes
- 3548 Cloman Way
- 3481 Cloman Way E
- 3568 Cloman Way
- 3580 68th St E
- 6445 Coryell Ct
- 6951 Clay Ave
- 3902 67th St E
- TBD 65th St E
- 7134 Claude Ave
- 4020 64th St E
- 7169 Clay Ave
- 6280 Carleda Way
- 7393 Clayton Ave
- 6050 Cahill Ave
- 6051 Concord Blvd
- 7344 Degrio Way
- 5938 Burke Trail
- 7602 Connie Ln
- 7614 Connie Ln
- Virginia Plan at Eagles Landing
- 3546 Cloman Way
- 3536 Cloman Way
- 3550 Cloman Way
- 3532 Cloman Way
- 3560 Cloman Way
- 3562 Cloman Way
- 3522 Cloman Way
- 3531 Cloman Way
- 3524 Cloman Way
- 3530 Cloman Way
- 3519 Cloman Way
- 3529 Cloman Way
- 3500 Cloman Way E
- 3500 Cloman Way
- 3564 Cloman Way
- 3564 Cloman Way E
- 3521 67th St E
- 3502 Cloman Way
- 3517 Cloman Way
- 3526 Cloman Way