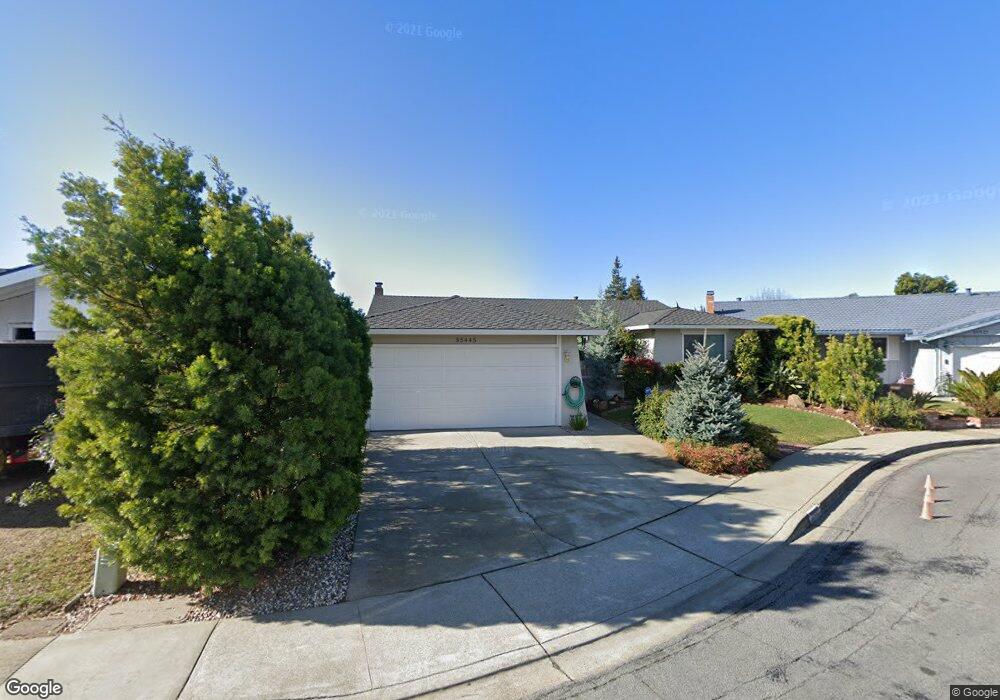
35445 Collier Place Fremont, CA 94536
Brookvale NeighborhoodEstimated Value: $1,648,000 - $1,802,000
4
Beds
2
Baths
1,734
Sq Ft
$983/Sq Ft
Est. Value
About This Home
This home is located at 35445 Collier Place, Fremont, CA 94536 and is currently estimated at $1,704,233, approximately $982 per square foot. 35445 Collier Place is a home located in Alameda County with nearby schools including Brookvale Elementary School, Thornton Middle School, and American High School.
Ownership History
Date
Name
Owned For
Owner Type
Purchase Details
Closed on
Jun 29, 2017
Sold by
Prucha Kenneth E and Prucha Huda F
Bought by
Prucha Kenneth E and Prucha Huda F
Current Estimated Value
Purchase Details
Closed on
Apr 17, 1997
Sold by
Faris Y F
Bought by
Prucha Kenneth E and Prucha Huda F
Home Financials for this Owner
Home Financials are based on the most recent Mortgage that was taken out on this home.
Original Mortgage
$30,000
Outstanding Balance
$3,909
Interest Rate
7.98%
Mortgage Type
Credit Line Revolving
Estimated Equity
$1,700,324
Purchase Details
Closed on
May 31, 1994
Sold by
Fang Weiping and Xiao Limin
Bought by
Prucha Kenneth E and Prucha Huda F
Home Financials for this Owner
Home Financials are based on the most recent Mortgage that was taken out on this home.
Original Mortgage
$176,000
Interest Rate
8.35%
Create a Home Valuation Report for This Property
The Home Valuation Report is an in-depth analysis detailing your home's value as well as a comparison with similar homes in the area
Home Values in the Area
Average Home Value in this Area
Purchase History
| Date | Buyer | Sale Price | Title Company |
|---|---|---|---|
| Prucha Kenneth E | -- | None Available | |
| Prucha Kenneth E | -- | First American | |
| Prucha Kenneth E | $220,000 | Golden Bay Title Company |
Source: Public Records
Mortgage History
| Date | Status | Borrower | Loan Amount |
|---|---|---|---|
| Open | Prucha Kenneth E | $30,000 | |
| Previous Owner | Prucha Kenneth E | $176,000 |
Source: Public Records
Tax History Compared to Growth
Tax History
| Year | Tax Paid | Tax Assessment Tax Assessment Total Assessment is a certain percentage of the fair market value that is determined by local assessors to be the total taxable value of land and additions on the property. | Land | Improvement |
|---|---|---|---|---|
| 2025 | $4,895 | $366,911 | $112,173 | $261,738 |
| 2024 | $4,895 | $359,581 | $109,974 | $256,607 |
| 2023 | $4,750 | $359,393 | $107,818 | $251,575 |
| 2022 | $4,669 | $345,347 | $105,704 | $246,643 |
| 2021 | $4,559 | $338,438 | $103,631 | $241,807 |
| 2020 | $4,512 | $341,897 | $102,569 | $239,328 |
| 2019 | $4,462 | $335,193 | $100,558 | $234,635 |
| 2018 | $4,372 | $328,621 | $98,586 | $230,035 |
| 2017 | $4,262 | $322,180 | $96,654 | $225,526 |
| 2016 | $4,180 | $315,864 | $94,759 | $221,105 |
| 2015 | $4,114 | $311,121 | $93,336 | $217,785 |
| 2014 | $4,036 | $305,027 | $91,508 | $213,519 |
Source: Public Records
Map
Nearby Homes
- 35415 Woodbridge Place
- 3184 Waugh Place
- 4027 Sunset Terrace
- 34926 Moina Shaiq Common
- 3134 Warwick Rd
- 3155 Mackenzie Place
- 34917 Sea Cliff Terrace
- 3751 Ruskin Place
- 34926 Osprey Dr
- 4015 Clydesdale Common
- 2224 Peacock Place Unit 3
- 34179 Bowling Green Common
- 2421 Maraschino Place
- 34552 Nantucket Common
- 34656 Greenstone Common
- 34512 Nantucket Common
- 2404 Maraschino Place
- 34233 Atteridge Place
- 34579 Bluestone Common
- 3371 Baywood Terrace Unit 214
- 35465 Collier Place
- 35425 Collier Place
- 35426 Morley Place
- 35485 Collier Place
- 35436 Morley Place
- 35405 Collier Place
- 35416 Morley Place
- 35456 Morley Place
- 35444 Collier Place
- 35464 Collier Place
- 35404 Collier Place
- 35515 Collier Place
- 35476 Morley Place
- 35484 Collier Place
- 35424 Collier Place
- 35406 Morley Place
- 35514 Collier Place
- 35535 Collier Place
- 35496 Morley Place
- 35529 Fisher Place