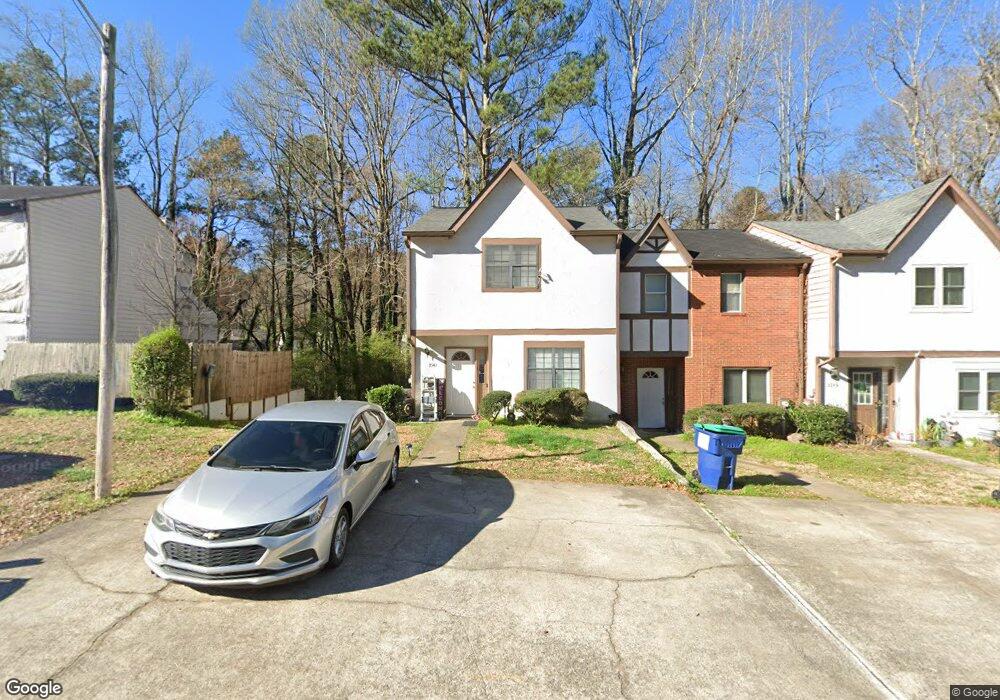
3545 Main Station Dr SW Marietta, GA 30008
Estimated Value: $190,760 - $217,000
2
Beds
3
Baths
1,184
Sq Ft
$174/Sq Ft
Est. Value
About This Home
This home is located at 3545 Main Station Dr SW, Marietta, GA 30008 and is currently estimated at $206,440, approximately $174 per square foot. 3545 Main Station Dr SW is a home located in Cobb County with nearby schools including Deerwood Elementary School, Sunrise Elementary School, and Sanders Elementary School.
Ownership History
Date
Name
Owned For
Owner Type
Purchase Details
Closed on
Jan 29, 2025
Sold by
Kucera Gary
Bought by
Dwelling Style Llc
Current Estimated Value
Purchase Details
Closed on
Mar 21, 2019
Sold by
Jaimes Marcia
Bought by
Kucera Gary
Purchase Details
Closed on
Oct 18, 2010
Sold by
Usa Investment Props Inc
Bought by
Jaimes Marcia
Purchase Details
Closed on
Aug 20, 2010
Sold by
Forrest Howard and Forrest Deborah D
Bought by
Usa Investment Props Inc
Purchase Details
Closed on
May 4, 2010
Sold by
Avery Ambrose
Bought by
Forrest Howard and Forrest Deborah D
Purchase Details
Closed on
Apr 23, 2007
Sold by
Forrest Howard and Forrest Deborah D
Bought by
Avery Ambrose
Home Financials for this Owner
Home Financials are based on the most recent Mortgage that was taken out on this home.
Original Mortgage
$85,000
Interest Rate
6.1%
Mortgage Type
Trade
Create a Home Valuation Report for This Property
The Home Valuation Report is an in-depth analysis detailing your home's value as well as a comparison with similar homes in the area
Home Values in the Area
Average Home Value in this Area
Purchase History
| Date | Buyer | Sale Price | Title Company |
|---|---|---|---|
| Dwelling Style Llc | -- | None Listed On Document | |
| Dwelling Style Llc | -- | None Listed On Document | |
| Kucera Gary | $58,500 | -- | |
| Jaimes Marcia | $40,000 | -- | |
| Usa Investment Props Inc | $32,000 | -- | |
| Forrest Howard | $50,000 | -- | |
| Avery Ambrose | $90,700 | -- |
Source: Public Records
Mortgage History
| Date | Status | Borrower | Loan Amount |
|---|---|---|---|
| Previous Owner | Avery Ambrose | $85,000 |
Source: Public Records
Tax History Compared to Growth
Tax History
| Year | Tax Paid | Tax Assessment Tax Assessment Total Assessment is a certain percentage of the fair market value that is determined by local assessors to be the total taxable value of land and additions on the property. | Land | Improvement |
|---|---|---|---|---|
| 2025 | $2,004 | $66,504 | $16,800 | $49,704 |
| 2024 | $2,005 | $66,504 | $16,800 | $49,704 |
| 2023 | $2,005 | $66,504 | $16,800 | $49,704 |
| 2022 | $710 | $23,400 | $4,880 | $18,520 |
| 2021 | $710 | $23,400 | $4,880 | $18,520 |
| 2020 | $710 | $23,400 | $4,880 | $18,520 |
| 2019 | $1,160 | $38,220 | $8,000 | $30,220 |
| 2018 | $921 | $30,360 | $4,800 | $25,560 |
| 2017 | $873 | $30,360 | $4,800 | $25,560 |
| 2016 | $727 | $25,284 | $4,800 | $20,484 |
| 2015 | $660 | $22,416 | $4,800 | $17,616 |
| 2014 | $385 | $12,948 | $0 | $0 |
Source: Public Records
Map
Nearby Homes
- 3580 Main Station Dr SW
- 3559 Ashley Station Dr SW
- 1905 Azure Grove Ct
- 1763 Merry Oak Rd SW
- 3530 Argent Way
- 3782 Mulkey Cir SW Unit 18
- 1810 Killarney Dr SW
- 2058 Mulkey Rd SW
- Reynolds Plan at Hampton Trace
- Forsyth Plan at Hampton Trace
- 1570 Halbrook Place SW
- 3661 Willingham Run SW
- 3722 Willingham Run SW
- 3726 Willingham Run SW
- 3730 Willingham Run SW
- 1745 Lansmere St SW
- 1688 Lansmere St SW
- 1713 Lansmere St SW
- 1717 Lansmere St SW
- 2289 Clare Cottage Cove SW
- 3547 Main Station Dr SW Unit 3547
- 3547 Main Station Dr SW
- 3547 Main Station Dr SW Unit 3
- 3549 Main Station Dr SW
- 3543 Main Station Dr SW
- 3551 Main Station Dr SW
- 3553 Main Station Dr SW Unit 3
- 3553 Main Station Dr SW
- 3539 Main Station Dr SW
- 3553 Main Unit 3553
- 3553 Main
- 3541 Main Station Dr SW
- 3537 Main Station Dr SW
- 3535 Main Station Dr SW Unit 3535
- 3535 Main Station Dr SW
- 3555 Main Station Dr SW
- 3550 Main Station Dr SW
- 3533 Main Station Dr SW
- 3552 Main Station Dr SW
- 3554 Main Station Dr SW