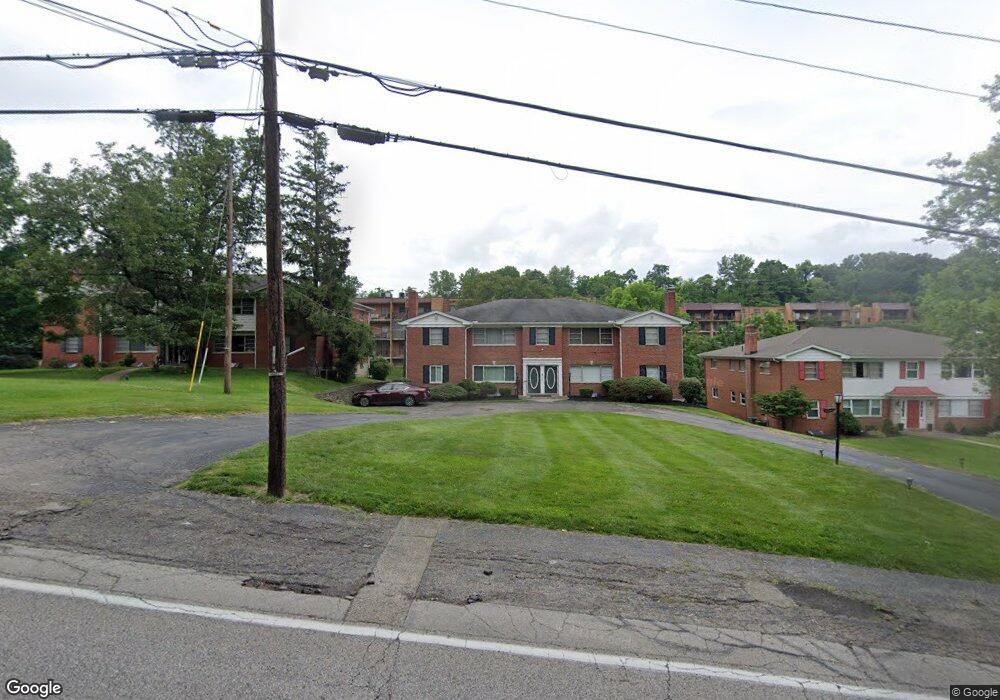
3545 Section Rd Cincinnati, OH 45237
Kennedy Heights NeighborhoodEstimated Value: $163,000 - $202,699
2
Beds
2
Baths
1,387
Sq Ft
$133/Sq Ft
Est. Value
About This Home
This home is located at 3545 Section Rd, Cincinnati, OH 45237 and is currently estimated at $184,175, approximately $132 per square foot. 3545 Section Rd is a home located in Hamilton County with nearby schools including Pleasant Ridge Montessori School, Shroder High School, and Clark Montessori High School.
Ownership History
Date
Name
Owned For
Owner Type
Purchase Details
Closed on
Aug 26, 2022
Sold by
Threatts Chelsea and Threatts Christopher Augustus
Bought by
Threatts Chelsea
Current Estimated Value
Home Financials for this Owner
Home Financials are based on the most recent Mortgage that was taken out on this home.
Original Mortgage
$99,000
Outstanding Balance
$82,459
Interest Rate
4.58%
Mortgage Type
New Conventional
Estimated Equity
$101,716
Purchase Details
Closed on
Feb 26, 2021
Sold by
Colonial Management Properties Llc
Bought by
Threatts Chelsea and Threatts Christopher Augustus
Home Financials for this Owner
Home Financials are based on the most recent Mortgage that was taken out on this home.
Original Mortgage
$98,900
Interest Rate
2.7%
Mortgage Type
New Conventional
Purchase Details
Closed on
Jun 15, 2020
Sold by
Best Kenneth A and Best Betty Sue
Bought by
Colonial Properties Management Llc
Purchase Details
Closed on
Jun 28, 2018
Sold by
Hawkins Lawrence C
Bought by
Best Kenneth Albert and Best Betty Sue
Purchase Details
Closed on
Jul 17, 2002
Sold by
Wolf Peggy H Tr and Paul
Bought by
Robbins Dewey F and Robbins Lorene L
Purchase Details
Closed on
May 11, 2000
Sold by
Wolf Peggy H
Bought by
Wolf Peggy H
Purchase Details
Closed on
Mar 1, 1994
Sold by
Wolf Stuart A
Bought by
Wolf Peggy H
Create a Home Valuation Report for This Property
The Home Valuation Report is an in-depth analysis detailing your home's value as well as a comparison with similar homes in the area
Home Values in the Area
Average Home Value in this Area
Purchase History
| Date | Buyer | Sale Price | Title Company |
|---|---|---|---|
| Threatts Chelsea | -- | None Listed On Document | |
| Threatts Chelsea | -- | None Listed On Document | |
| Threatts Chelsea | $109,900 | 360 American Title | |
| Threatts Chelsea | $109,900 | 360 American Title | |
| Colonial Properties Management Llc | -- | None Available | |
| Best Kenneth Albert | $55,000 | None Available | |
| Robbins Dewey F | $97,500 | -- | |
| Wolf Peggy H | -- | -- | |
| Wolf Peggy H | -- | -- |
Source: Public Records
Mortgage History
| Date | Status | Borrower | Loan Amount |
|---|---|---|---|
| Open | Threatts Chelsea | $99,000 | |
| Closed | Threatts Chelsea | $99,000 | |
| Previous Owner | Threatts Chelsea | $98,900 |
Source: Public Records
Tax History
| Year | Tax Paid | Tax Assessment Tax Assessment Total Assessment is a certain percentage of the fair market value that is determined by local assessors to be the total taxable value of land and additions on the property. | Land | Improvement |
|---|---|---|---|---|
| 2025 | $2,370 | $38,465 | $5,250 | $33,215 |
| 2024 | $2,298 | $38,465 | $5,250 | $33,215 |
| 2023 | $2,349 | $38,465 | $5,250 | $33,215 |
| 2022 | $1,360 | $19,250 | $5,250 | $14,000 |
| 2021 | $1,336 | $19,250 | $5,250 | $14,000 |
| 2020 | $1,336 | $19,250 | $5,250 | $14,000 |
| 2019 | $1,733 | $22,677 | $5,250 | $17,427 |
| 2018 | $1,735 | $22,677 | $5,250 | $17,427 |
| 2017 | $965 | $22,677 | $5,250 | $17,427 |
| 2016 | $1,045 | $23,709 | $5,250 | $18,459 |
| 2015 | $949 | $23,709 | $5,250 | $18,459 |
| 2014 | $957 | $23,709 | $5,250 | $18,459 |
| 2013 | $974 | $23,709 | $5,250 | $18,459 |
Source: Public Records
Map
Nearby Homes
- 3521 Section Rd
- 3533 Amberacres Dr
- 3563 Amberacres Dr
- 6470 Crestview Ave
- 6454 Crestview Ave
- 6466 Crestview Ave
- 6462 Crestview Ave
- 6458 Crestview Ave
- 6460 Mchugh Place
- 3814 N Broadlawn Cir
- 6508 Coleridge Ave
- 6501 Coleridge Ave
- 3523 Mary Ann Ln
- 3911 E Gatewood Ln
- 6256 Rogers Park Place
- 3822 Odin Ave
- 3625 Zinsle Ave
- 7651 Sagamore Dr
- 6829 Alpine Ave
- 4025 Deer Park Ave
- 3545 Section Rd Unit 1E
- 3545 Section Rd
- 3545 Section Rd
- 3545 Section Rd Unit 2W
- 3553 Section Rd Unit 1E
- 3553 Section Rd
- 3553 Section Rd
- 3553 Section Rd
- 3553 Section Rd Unit 1W
- 3553 Section Rd Unit 3
- 3561 Section Rd
- 3561 Section Rd
- 3561 Section Rd
- 3561 Section Rd Unit 1
- 3561 Section Rd Unit 2
- 3561 Section Rd Unit 4
- 3529 Section Rd Unit 3
- 3529 Section Rd
- 3529 Section Rd
- 3529 Section Rd Unit 1
Your Personal Tour Guide
Ask me questions while you tour the home.